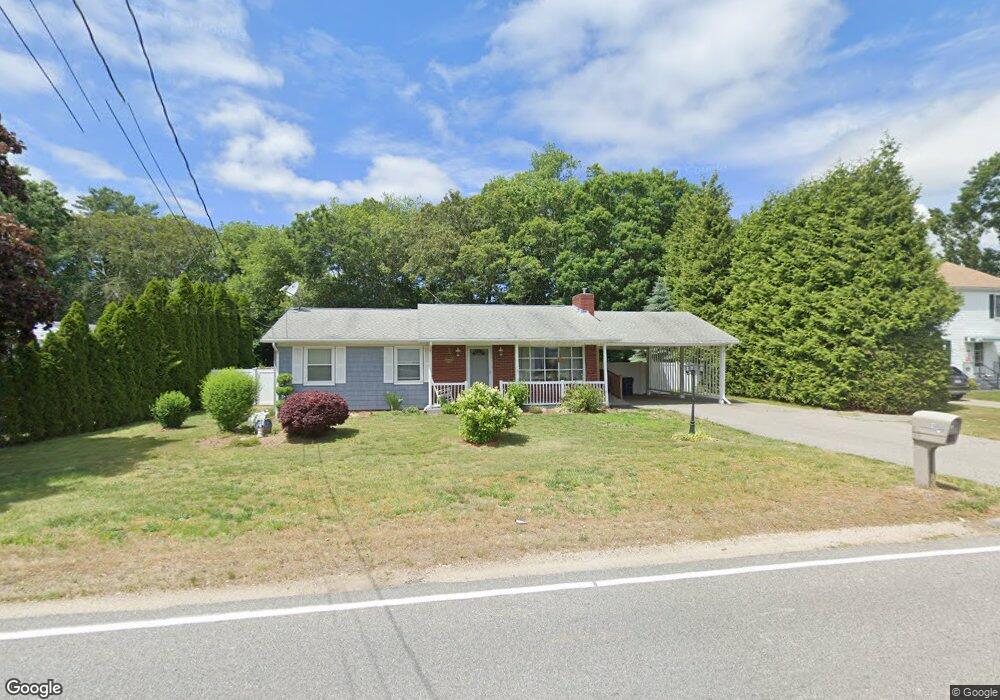
101 Briggs Rd Westport, MA 02790
North Westport NeighborhoodEstimated Value: $413,000 - $671,000
3
Beds
1
Bath
1,050
Sq Ft
$481/Sq Ft
Est. Value
About This Home
This home is located at 101 Briggs Rd, Westport, MA 02790 and is currently estimated at $504,717, approximately $480 per square foot. 101 Briggs Rd is a home located in Bristol County with nearby schools including Alice A. Macomber Primary School, Westport Elementary School, and Espirito Santo Parochial School.
Ownership History
Date
Name
Owned For
Owner Type
Purchase Details
Closed on
Sep 4, 2019
Sold by
Rodrigues Cynthia
Bought by
Rodrigues Cynthia and Vieira Keith N
Current Estimated Value
Purchase Details
Closed on
May 31, 2018
Sold by
Rodrigues John and Rodrigues Cynthia
Bought by
Rodrigues Cynthia
Purchase Details
Closed on
Apr 17, 2008
Sold by
Silvia Doris A R
Bought by
Rodrigues Cynthia and Rodrigues John
Home Financials for this Owner
Home Financials are based on the most recent Mortgage that was taken out on this home.
Original Mortgage
$229,600
Interest Rate
6.1%
Mortgage Type
Purchase Money Mortgage
Purchase Details
Closed on
Sep 1, 2005
Sold by
Martin Joann M and Czapiga Richard
Bought by
Silvia Doris A R
Purchase Details
Closed on
May 29, 2001
Sold by
Jackson Colin Est
Bought by
Czapiga Richard and Martin Jo Ann M
Create a Home Valuation Report for This Property
The Home Valuation Report is an in-depth analysis detailing your home's value as well as a comparison with similar homes in the area
Home Values in the Area
Average Home Value in this Area
Purchase History
| Date | Buyer | Sale Price | Title Company |
|---|---|---|---|
| Rodrigues Cynthia | -- | -- | |
| Rodrigues Cynthia | -- | -- | |
| Rodrigues Cynthia | $287,000 | -- | |
| Silvia Doris A R | $275,000 | -- | |
| Czapiga Richard | $100,000 | -- |
Source: Public Records
Mortgage History
| Date | Status | Borrower | Loan Amount |
|---|---|---|---|
| Previous Owner | Czapiga Richard | $229,600 | |
| Previous Owner | Czapiga Richard | $229,600 |
Source: Public Records
Tax History Compared to Growth
Tax History
| Year | Tax Paid | Tax Assessment Tax Assessment Total Assessment is a certain percentage of the fair market value that is determined by local assessors to be the total taxable value of land and additions on the property. | Land | Improvement |
|---|---|---|---|---|
| 2025 | $2,487 | $333,800 | $168,600 | $165,200 |
| 2024 | $2,417 | $312,700 | $149,700 | $163,000 |
| 2023 | $2,304 | $282,300 | $136,300 | $146,000 |
| 2022 | $2,043 | $260,600 | $136,300 | $124,300 |
| 2021 | $2,043 | $237,000 | $112,700 | $124,300 |
| 2020 | $1,960 | $232,500 | $108,200 | $124,300 |
| 2019 | $1,920 | $232,200 | $108,200 | $124,000 |
| 2018 | $1,862 | $227,900 | $116,400 | $111,500 |
| 2017 | $1,799 | $225,700 | $116,400 | $109,300 |
| 2016 | $1,706 | $215,700 | $116,400 | $99,300 |
| 2015 | $1,627 | $205,200 | $116,400 | $88,800 |
Source: Public Records
Map
Nearby Homes