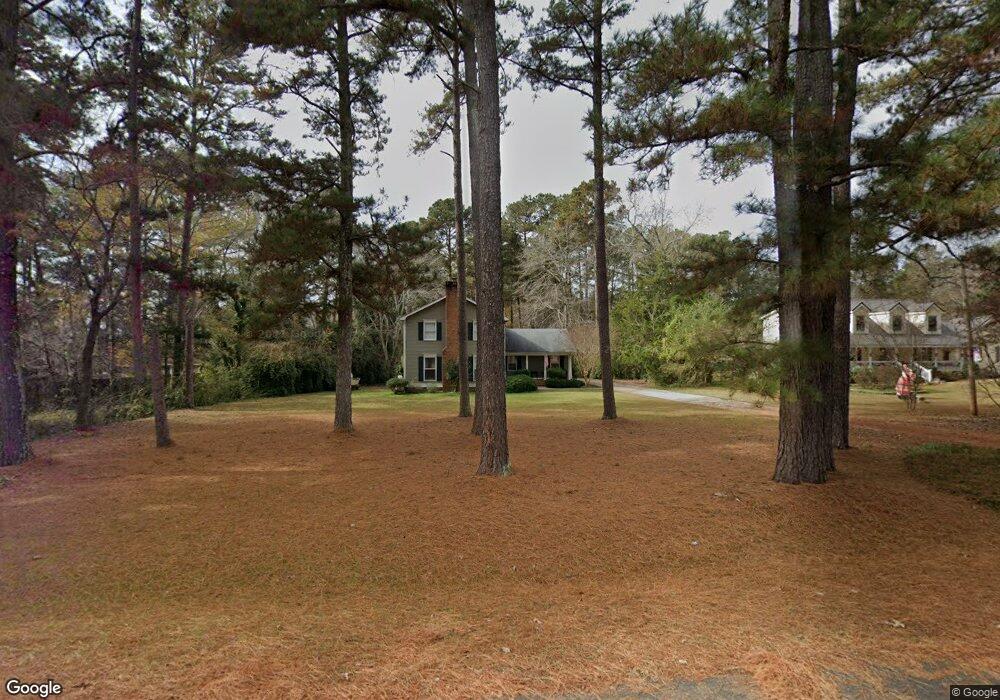
101 Brittney Ln Unit 5 Lagrange, GA 30240
Estimated Value: $284,000 - $302,000
4
Beds
3
Baths
2,194
Sq Ft
$133/Sq Ft
Est. Value
About This Home
This home is located at 101 Brittney Ln Unit 5, Lagrange, GA 30240 and is currently estimated at $292,032, approximately $133 per square foot. 101 Brittney Ln Unit 5 is a home located in Troup County with nearby schools including Long Cane Elementary School, Berta Weathersbee Elementary School, and Whitesville Road Elementary School.
Ownership History
Date
Name
Owned For
Owner Type
Purchase Details
Closed on
Apr 25, 2008
Sold by
Moat Thomas
Bought by
Moat J Scott
Current Estimated Value
Home Financials for this Owner
Home Financials are based on the most recent Mortgage that was taken out on this home.
Original Mortgage
$148,000
Outstanding Balance
$93,433
Interest Rate
5.82%
Mortgage Type
New Conventional
Estimated Equity
$198,599
Purchase Details
Closed on
May 15, 2003
Sold by
Phillips Marion and Phillips Theresa
Bought by
Teresa Thomas and Teresa Moat
Purchase Details
Closed on
Jun 29, 1996
Sold by
Harold C Edmondson
Bought by
Phillips Marion and Phillips Theresa
Purchase Details
Closed on
Nov 17, 1986
Bought by
Harold C Edmondson
Purchase Details
Closed on
Nov 1, 1986
Purchase Details
Closed on
Dec 1, 1985
Purchase Details
Closed on
Mar 23, 1978
Create a Home Valuation Report for This Property
The Home Valuation Report is an in-depth analysis detailing your home's value as well as a comparison with similar homes in the area
Home Values in the Area
Average Home Value in this Area
Purchase History
| Date | Buyer | Sale Price | Title Company |
|---|---|---|---|
| Moat J Scott | $185,000 | -- | |
| Teresa Thomas | $146,000 | -- | |
| Phillips Marion | $112,000 | -- | |
| Harold C Edmondson | $93,300 | -- | |
| -- | -- | -- | |
| -- | $11,000 | -- | |
| -- | -- | -- |
Source: Public Records
Mortgage History
| Date | Status | Borrower | Loan Amount |
|---|---|---|---|
| Open | Moat J Scott | $148,000 | |
| Closed | Moat J Scott | $22,000 |
Source: Public Records
Tax History Compared to Growth
Tax History
| Year | Tax Paid | Tax Assessment Tax Assessment Total Assessment is a certain percentage of the fair market value that is determined by local assessors to be the total taxable value of land and additions on the property. | Land | Improvement |
|---|---|---|---|---|
| 2024 | $2,280 | $83,600 | $14,000 | $69,600 |
| 2023 | $2,372 | $86,960 | $14,000 | $72,960 |
| 2022 | $2,187 | $78,360 | $10,000 | $68,360 |
| 2021 | $2,061 | $68,320 | $8,000 | $60,320 |
| 2020 | $2,061 | $68,320 | $8,000 | $60,320 |
| 2019 | $2,059 | $68,280 | $8,000 | $60,280 |
| 2018 | $1,968 | $65,240 | $8,000 | $57,240 |
| 2017 | $1,964 | $65,120 | $8,000 | $57,120 |
| 2016 | $1,874 | $64,112 | $10,000 | $54,112 |
| 2015 | $1,877 | $64,112 | $10,000 | $54,112 |
| 2014 | $1,794 | $61,264 | $10,000 | $51,264 |
| 2013 | -- | $64,468 | $10,000 | $54,468 |
Source: Public Records
Map
Nearby Homes
- 102 Franklin Place
- 119 Plymouth Dr
- 101 Ivy Springs Dr
- 141 Plymouth Dr
- 474 Newton Rd
- 40 River Point Dr
- 108 Hidden Springs Dr
- 1565 Glass Bridge Rd
- 106 Landings Way
- 102 Landings Way
- 101 Riverbluff Dr
- 109 Riverbluff Dr
- 201 Lakeview Ct
- 105 Hawthorne Cir
- 103 Hawthorne Cir
- 110 Hawthorne Cir
- 100 Huntcliff Ct
- 135 Planters Ridge Dr
- 124 Foxdale Dr
- 394 Ferrell Tatum Rd
- 101 Brittney Ln
- 103 Brittney Ln
- 1002 Glass Bridge Rd
- 99 Brittney Ln
- 105 Brittney Ln
- 1016 Glass Bridge Rd
- 102 Washington Way
- 100 Washington Way
- 98 Brittney Ln
- 100 Brittney Ln
- 107 Brittney Ln Unit 11
- 107 Brittney Ln
- 104 Washington Way
- 1030 Glass Bridge Rd
- 102 Brittney Ln
- 104 Brittney Ln
- 942 Glass Bridge Rd
- 109 Brittney Ln
- 106 Washington Way
- 1512 Glass Bridge Rd