Estimated Value: $306,000 - $330,000
3
Beds
2
Baths
1,551
Sq Ft
$202/Sq Ft
Est. Value
About This Home
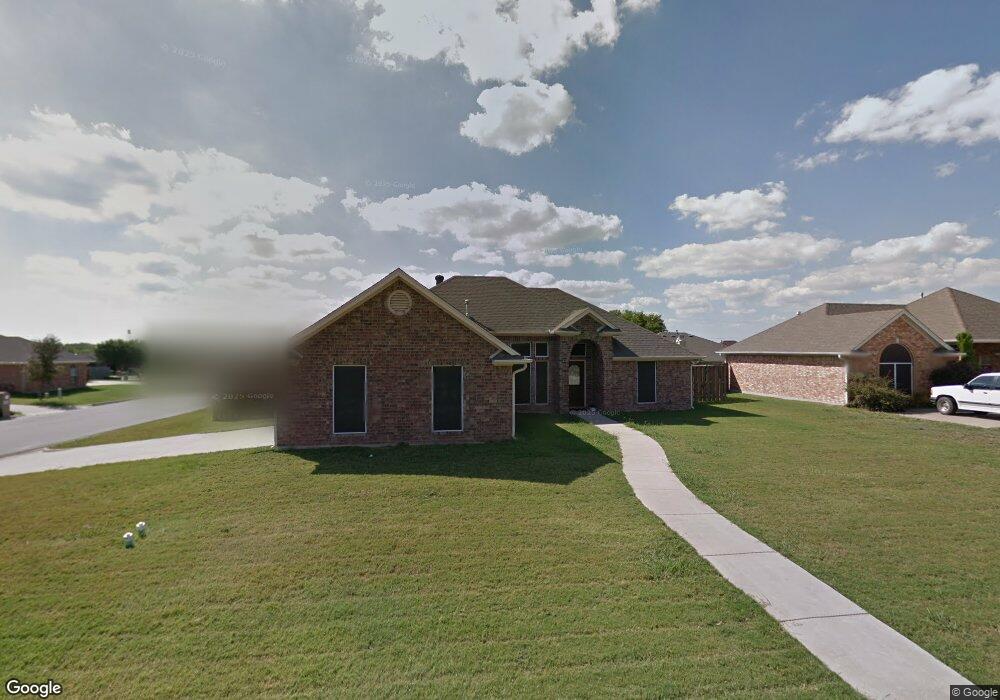
This home is located at 101 Carissa Ct, Krum, TX 76249 and is currently estimated at $313,946, approximately $202 per square foot. 101 Carissa Ct is a home located in Denton County with nearby schools including Krum Early Education Center, Blanche Dodd Intermediate School, and Krum Middle School.
Ownership History
Date
Name
Owned For
Owner Type
Purchase Details
Closed on
May 24, 2021
Sold by
Huckaby Eddle D
Bought by
Niehaus Jason
Current Estimated Value
Home Financials for this Owner
Home Financials are based on the most recent Mortgage that was taken out on this home.
Original Mortgage
$187,120
Outstanding Balance
$169,577
Interest Rate
3.1%
Mortgage Type
New Conventional
Estimated Equity
$144,369
Purchase Details
Closed on
Dec 13, 2012
Sold by
Calaway Mark Lester
Bought by
Huckaby Eddie D
Home Financials for this Owner
Home Financials are based on the most recent Mortgage that was taken out on this home.
Original Mortgage
$122,634
Interest Rate
3.5%
Mortgage Type
FHA
Purchase Details
Closed on
Apr 1, 2002
Sold by
Mill Bow Homes Inc
Bought by
Calaway Mark Lester
Home Financials for this Owner
Home Financials are based on the most recent Mortgage that was taken out on this home.
Original Mortgage
$100,000
Interest Rate
6.78%
Purchase Details
Closed on
Mar 29, 2001
Sold by
Gill Donald F
Bought by
Mill Bow Homes Inc
Create a Home Valuation Report for This Property
The Home Valuation Report is an in-depth analysis detailing your home's value as well as a comparison with similar homes in the area
Home Values in the Area
Average Home Value in this Area
Purchase History
| Date | Buyer | Sale Price | Title Company |
|---|---|---|---|
| Niehaus Jason | -- | Capital Title | |
| Huckaby Eddie D | -- | None Available | |
| Calaway Mark Lester | -- | -- | |
| Mill Bow Homes Inc | -- | -- |
Source: Public Records
Mortgage History
| Date | Status | Borrower | Loan Amount |
|---|---|---|---|
| Open | Niehaus Jason | $187,120 | |
| Previous Owner | Huckaby Eddie D | $122,634 | |
| Previous Owner | Calaway Mark Lester | $100,000 |
Source: Public Records
Tax History Compared to Growth
Tax History
| Year | Tax Paid | Tax Assessment Tax Assessment Total Assessment is a certain percentage of the fair market value that is determined by local assessors to be the total taxable value of land and additions on the property. | Land | Improvement |
|---|---|---|---|---|
| 2025 | $5,090 | $301,005 | $65,144 | $235,861 |
| 2024 | $6,329 | $314,066 | $65,144 | $248,922 |
| 2023 | $4,793 | $298,877 | $65,144 | $249,951 |
| 2022 | $6,232 | $271,706 | $65,144 | $206,562 |
| 2021 | $4,465 | $207,551 | $38,320 | $169,231 |
| 2020 | $4,145 | $183,042 | $38,320 | $144,722 |
| 2019 | $4,199 | $174,000 | $38,320 | $135,680 |
| 2018 | $4,026 | $166,000 | $38,320 | $127,680 |
| 2017 | $3,804 | $156,153 | $38,320 | $139,815 |
| 2016 | $3,458 | $141,957 | $38,320 | $116,608 |
| 2015 | $2,655 | $129,052 | $38,320 | $108,430 |
| 2014 | $2,655 | $117,320 | $26,824 | $90,496 |
| 2013 | -- | $124,119 | $26,824 | $97,295 |
Source: Public Records
Map
Nearby Homes