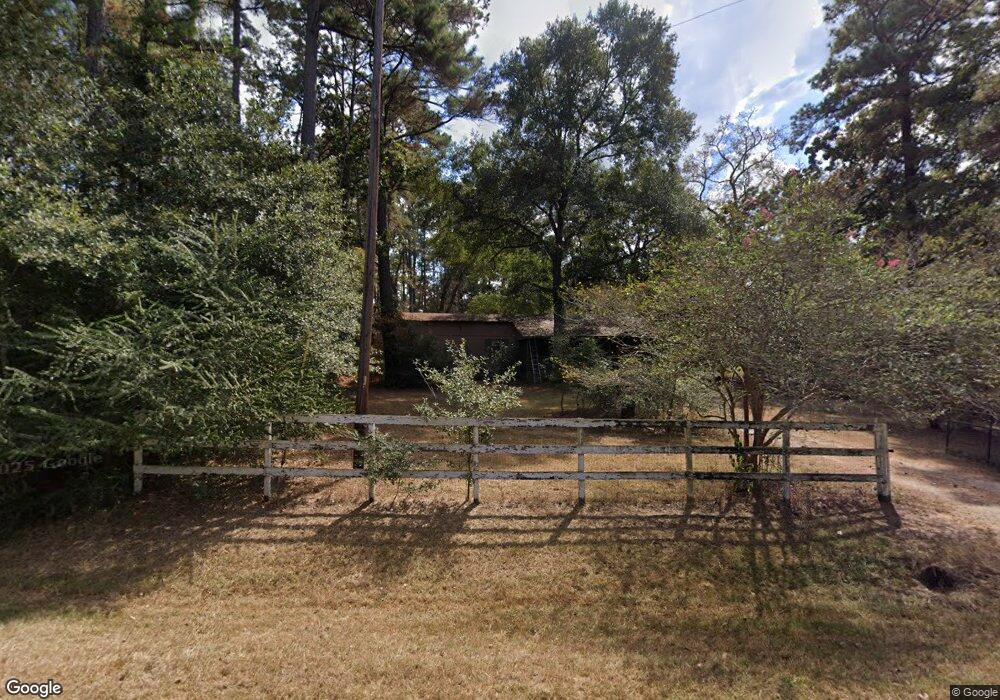
101 Cedar Ct Magnolia, TX 77355
Estimated Value: $216,000 - $232,000
3
Beds
2
Baths
1,216
Sq Ft
$187/Sq Ft
Est. Value
About This Home
This home is located at 101 Cedar Ct, Magnolia, TX 77355 and is currently estimated at $227,207, approximately $186 per square foot. 101 Cedar Ct is a home located in Waller County with nearby schools including Fields Store Elementary School, Schultz Junior High School, and Waller High School.
Ownership History
Date
Name
Owned For
Owner Type
Purchase Details
Closed on
Aug 31, 2009
Sold by
Secretary Of Housing & Urban Development
Bought by
Tomchesson Debbie A
Current Estimated Value
Purchase Details
Closed on
Jun 4, 2009
Sold by
Jpmorgan Chase Bank National Association
Bought by
The Secretary Of Housing & Urban Develop
Purchase Details
Closed on
May 5, 2009
Sold by
Tanner Robert L and Tanner Wanda J
Bought by
Jpmorgan Chase Bank National Association
Purchase Details
Closed on
Aug 24, 2007
Sold by
Secretary Of Hud
Bought by
Washington Mutual Bank Fa
Purchase Details
Closed on
Jul 11, 2006
Sold by
Washington Mutual Bank Fa
Bought by
Secretary Of Hud
Purchase Details
Closed on
Jul 5, 2006
Sold by
Tanner Robert L and Tanner Wanda J
Bought by
Washington Mutual Bank Fa
Create a Home Valuation Report for This Property
The Home Valuation Report is an in-depth analysis detailing your home's value as well as a comparison with similar homes in the area
Home Values in the Area
Average Home Value in this Area
Purchase History
| Date | Buyer | Sale Price | Title Company |
|---|---|---|---|
| Tomchesson Debbie A | -- | None Available | |
| The Secretary Of Housing & Urban Develop | -- | None Available | |
| Jpmorgan Chase Bank National Association | $126,746 | None Available | |
| Washington Mutual Bank Fa | -- | None Available | |
| Secretary Of Hud | -- | None Available | |
| Washington Mutual Bank Fa | $50,402 | None Available |
Source: Public Records
Tax History Compared to Growth
Tax History
| Year | Tax Paid | Tax Assessment Tax Assessment Total Assessment is a certain percentage of the fair market value that is determined by local assessors to be the total taxable value of land and additions on the property. | Land | Improvement |
|---|---|---|---|---|
| 2025 | $1 | $110,097 | -- | -- |
| 2024 | $1 | $100,088 | -- | -- |
| 2023 | $1 | $90,989 | $0 | $0 |
| 2022 | $553 | $82,717 | -- | -- |
| 2021 | $1,566 | $95,990 | $52,520 | $43,470 |
| 2020 | $1,458 | $98,370 | $52,520 | $45,850 |
| 2019 | $1,384 | $78,810 | $45,450 | $33,360 |
| 2018 | $1,244 | $57,680 | $42,670 | $15,010 |
| 2017 | $1,116 | $51,360 | $34,340 | $17,020 |
| 2016 | $1,064 | $48,980 | $32,320 | $16,660 |
| 2015 | -- | $39,990 | $26,770 | $13,220 |
| 2014 | -- | $43,710 | $29,690 | $14,020 |
Source: Public Records
Map
Nearby Homes
- 378 Ridgewood Dr
- 149 Cedar Ct
- 114 Oak Hills Ct
- 26077 Forestcrest Ct
- 126 Oak Hills Ct
- 169 Woodway Dr
- 290 Greenbriar Dr
- 24290 Deerbrook Dr
- 27896 Rice Rd
- 16302 Bermuda Field St
- 16206 Rustic Prairie Dr
- 16106 Rustic Prairie Dr
- 17411 Lavender Blossom Ln
- 29030 Bison Haven Dr
- 29026 Bison Haven Dr
- 29022 Bison Haven Dr
- 16222 Rustic Prairie Dr
- 16103 Rustic Prairie Dr
- 16111 Rustic Prairie Dr
- 16114 Rustic Prairie Dr
- 105 Cedar Ct
- 109 Cedar Ct
- 222 Oak Hollow Blvd
- 113 Cedar Ct
- 240 Oak Hollow Blvd
- 26030 Bent Oak Dr
- 110 Cedar Ct
- 246 Oak Hollow Blvd
- 117 Cedar Ct
- 218 Oak Hollow Blvd
- 248 Oak Hollow Blvd
- 26036 Bent Oak Dr
- 26024 Bent Oak Dr
- 26012 Bent Oak Dr
- 26042 Bent Oak Dr
- 121 Cedar Ct
- O Oak Hollow
- 120 Cedar Ct
- 229 Oak Hollow Blvd
- 000 Oak Hollow Blvd