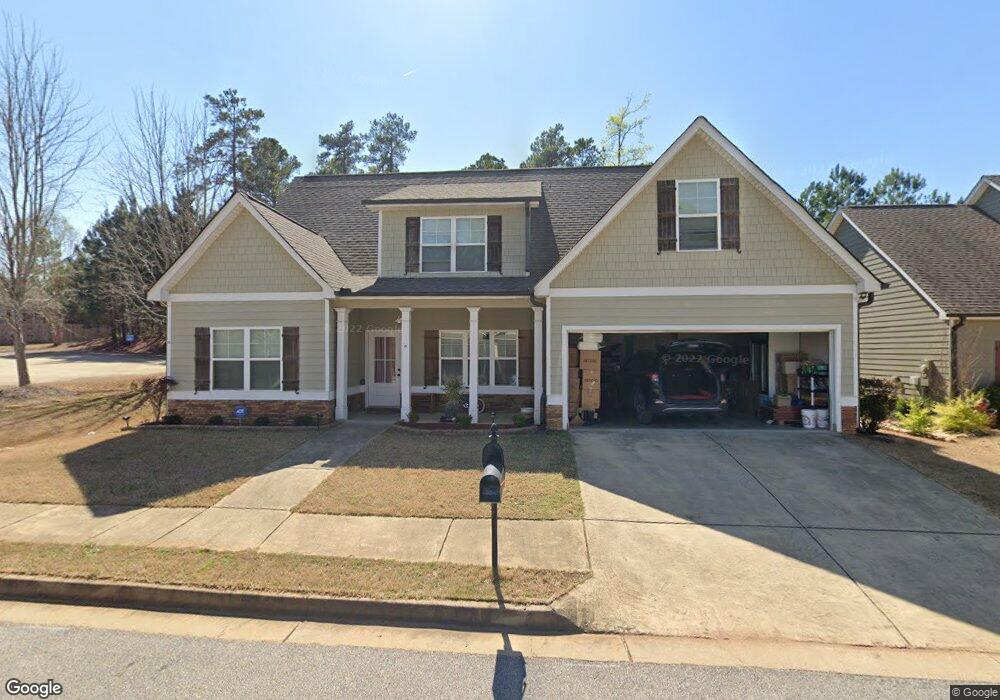
101 Celebration Blvd Unit B Lagrange, GA 30241
Estimated Value: $318,674 - $399,000
4
Beds
2
Baths
2,010
Sq Ft
$178/Sq Ft
Est. Value
About This Home
This home is located at 101 Celebration Blvd Unit B, Lagrange, GA 30241 and is currently estimated at $357,919, approximately $178 per square foot. 101 Celebration Blvd Unit B is a home located in Troup County with nearby schools including Franklin Forest Elementary School, Hollis Hand Elementary School, and Ethel W. Kight Elementary School.
Ownership History
Date
Name
Owned For
Owner Type
Purchase Details
Closed on
Aug 22, 2014
Sold by
Lifestyle Construction & D
Bought by
Lin Yue Qin and Xie Zhu Qin
Current Estimated Value
Home Financials for this Owner
Home Financials are based on the most recent Mortgage that was taken out on this home.
Original Mortgage
$156,800
Outstanding Balance
$119,961
Interest Rate
4.2%
Mortgage Type
New Conventional
Estimated Equity
$237,958
Purchase Details
Closed on
Aug 15, 2014
Sold by
Black Horse Properties Llc
Bought by
Lifestyle Construction & Desig
Home Financials for this Owner
Home Financials are based on the most recent Mortgage that was taken out on this home.
Original Mortgage
$156,800
Outstanding Balance
$119,961
Interest Rate
4.2%
Mortgage Type
New Conventional
Estimated Equity
$237,958
Purchase Details
Closed on
Oct 3, 2012
Sold by
Selbie Frederic
Bought by
Black Horse Properties Llc
Purchase Details
Closed on
Sep 25, 2012
Sold by
Ps Homecoming Llc
Bought by
Selbie Frederic
Create a Home Valuation Report for This Property
The Home Valuation Report is an in-depth analysis detailing your home's value as well as a comparison with similar homes in the area
Home Values in the Area
Average Home Value in this Area
Purchase History
| Date | Buyer | Sale Price | Title Company |
|---|---|---|---|
| Lin Yue Qin | $196,000 | -- | |
| Lifestyle Construction & Desig | $196,000 | -- | |
| Black Horse Properties Llc | $319,558 | -- | |
| Selbie Frederic | $310,000 | -- |
Source: Public Records
Mortgage History
| Date | Status | Borrower | Loan Amount |
|---|---|---|---|
| Open | Lin Yue Qin | $156,800 |
Source: Public Records
Tax History Compared to Growth
Tax History
| Year | Tax Paid | Tax Assessment Tax Assessment Total Assessment is a certain percentage of the fair market value that is determined by local assessors to be the total taxable value of land and additions on the property. | Land | Improvement |
|---|---|---|---|---|
| 2024 | $2,890 | $105,960 | $8,000 | $97,960 |
| 2023 | $2,807 | $102,920 | $4,000 | $98,920 |
| 2022 | $2,693 | $96,480 | $4,000 | $92,480 |
| 2021 | $2,717 | $90,080 | $4,000 | $86,080 |
| 2020 | $2,717 | $90,080 | $4,000 | $86,080 |
| 2019 | $2,416 | $80,120 | $4,000 | $76,120 |
| 2018 | $2,416 | $80,120 | $4,000 | $76,120 |
| 2017 | $2,416 | $80,120 | $4,000 | $76,120 |
| 2016 | $2,417 | $80,152 | $4,000 | $76,152 |
| 2015 | $2,368 | $78,400 | $3,849 | $74,551 |
| 2014 | $51 | $2,000 | $2,000 | $0 |
| 2013 | -- | $3,000 | $3,000 | $0 |
Source: Public Records
Map
Nearby Homes
- 793 Celebration Blvd
- 112 Celebration Blvd
- 117 Celebration Blvd
- 129 Celebration Blvd
- 509 Youngs Mill Rd
- 517 Tradition Place
- 519 Tradition Place
- 105 Ridgefield Dr
- 114 Crestwood Dr
- 200 Crestwood Dr
- 125 Ridgefield Cir
- 207 Baileys Way
- 121 Woodridge Cir
- 121 Ct
- 105 Lenox Cir
- 101 Lenox Cir
- 113 Woodridge Cir
- 305 Lenox Cir
- 400 S Page St
- 300 Old Pond Rd
- 101 Celebration Blvd
- 101 Celebration Blvd Unit A
- 103 Celebration Blvd
- 100 Celebration Blvd Unit LOT 178
- 100 Celebration Blvd
- 105 Celebration Blvd
- 102 Celebration Blvd Unit LOT 179
- 102 Celebration Blvd
- 104 Celebration Blvd Unit LOT 180
- 104 Celebration Blvd
- 798 Celebration Blvd
- 107B Celebration Blvd
- 107A Celebration Blvd
- 107 Celebration Blvd Unit 107B
- 107 Celebration Blvd Unit B
- 107 Celebration Blvd Unit A
- 107 Celebration Blvd
- 796 Celebration Blvd Unit LOT 293
- 796 Celebration Blvd
- 109 Celebration Blvd