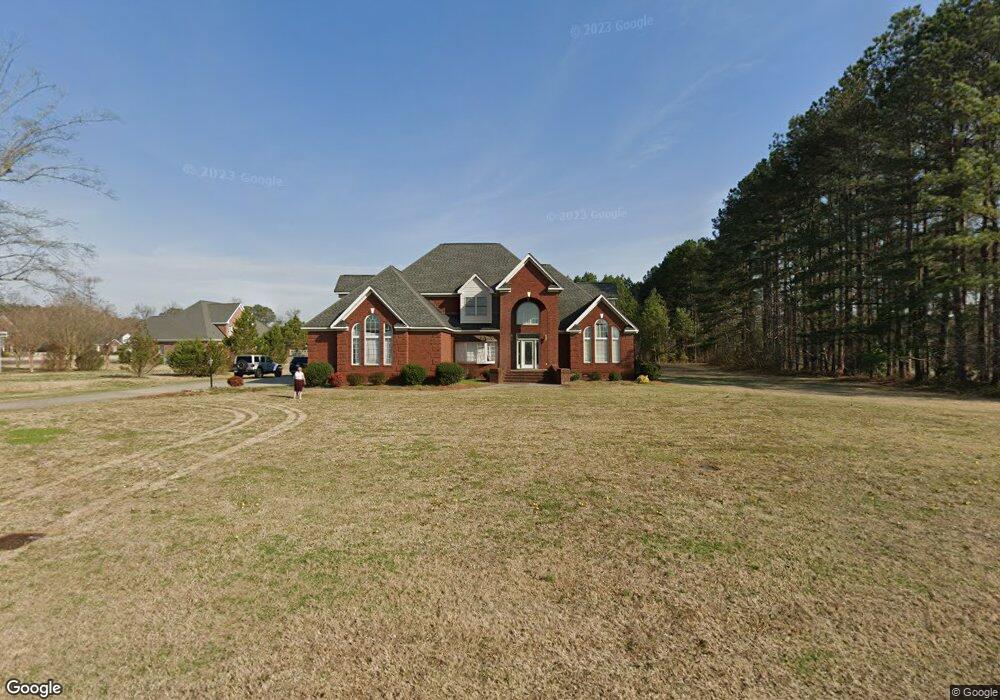
101 Chancery Dr Goldsboro, NC 27530
Estimated Value: $484,000 - $548,038
4
Beds
4
Baths
3,756
Sq Ft
$139/Sq Ft
Est. Value
About This Home
This home is located at 101 Chancery Dr, Goldsboro, NC 27530 and is currently estimated at $522,260, approximately $139 per square foot. 101 Chancery Dr is a home located in Wayne County with nearby schools including Northwest Elementary School, Norwayne Middle School, and Charles B. Aycock High School.
Ownership History
Date
Name
Owned For
Owner Type
Purchase Details
Closed on
Jan 18, 2024
Sold by
Hanshali Adel M and Hanshali Badriyah S
Bought by
Saleh Ahmed Abdulla
Current Estimated Value
Home Financials for this Owner
Home Financials are based on the most recent Mortgage that was taken out on this home.
Original Mortgage
$350,000
Outstanding Balance
$307,135
Interest Rate
6.95%
Mortgage Type
Seller Take Back
Estimated Equity
$215,125
Purchase Details
Closed on
May 17, 2007
Sold by
Browden Franklin D and Browden Jeannette D
Bought by
Hanshali Adel M and Albarati Nawaf K
Home Financials for this Owner
Home Financials are based on the most recent Mortgage that was taken out on this home.
Original Mortgage
$175,000
Interest Rate
6.12%
Mortgage Type
Future Advance Clause Open End Mortgage
Purchase Details
Closed on
Feb 1, 2004
Purchase Details
Closed on
Aug 1, 2003
Create a Home Valuation Report for This Property
The Home Valuation Report is an in-depth analysis detailing your home's value as well as a comparison with similar homes in the area
Home Values in the Area
Average Home Value in this Area
Purchase History
| Date | Buyer | Sale Price | Title Company |
|---|---|---|---|
| Saleh Ahmed Abdulla | $400,000 | None Listed On Document | |
| Hanshali Adel M | $225,000 | None Availabel | |
| -- | $348,000 | -- | |
| -- | $22,500 | -- |
Source: Public Records
Mortgage History
| Date | Status | Borrower | Loan Amount |
|---|---|---|---|
| Open | Saleh Ahmed Abdulla | $350,000 | |
| Previous Owner | Hanshali Adel M | $175,000 |
Source: Public Records
Tax History Compared to Growth
Tax History
| Year | Tax Paid | Tax Assessment Tax Assessment Total Assessment is a certain percentage of the fair market value that is determined by local assessors to be the total taxable value of land and additions on the property. | Land | Improvement |
|---|---|---|---|---|
| 2025 | $5,694 | $538,800 | $42,000 | $496,800 |
| 2024 | $5,135 | $377,810 | $35,000 | $342,810 |
| 2023 | $5,120 | $377,810 | $35,000 | $342,810 |
| 2022 | $5,200 | $377,810 | $35,000 | $342,810 |
| 2021 | $5,147 | $377,810 | $35,000 | $342,810 |
| 2020 | $5,060 | $377,810 | $35,000 | $342,810 |
| 2018 | $2,936 | $401,060 | $35,000 | $366,060 |
| 2017 | $2,936 | $401,060 | $35,000 | $366,060 |
| 2016 | $2,936 | $401,060 | $35,000 | $366,060 |
| 2015 | $2,942 | $401,060 | $35,000 | $366,060 |
| 2014 | $2,948 | $401,060 | $35,000 | $366,060 |
Source: Public Records
Map
Nearby Homes
- 276 Buck Swamp Rd
- 106 Yelverton Place
- 301 Woodview Dr
- 303 Woodview Dr
- 3418 U S 117
- 101 Mcwood Place
- 176 Perkins Rd
- 227 Belfast Ave
- 626 Adler Ln
- 203 Lane Tree Dr
- 608 Adler Ln
- 220 Airport Rd NE
- 139 Livingston Dr
- 220 Creek Ridge Dr
- 408 Perkins Rd
- 302 Morgan Trace Ln
- 142 Hillside Dr
- 155 Hillside Dr
- 109 Ashworth Dr
- 479 Perkins Rd
- 106 Coventry Dr
- 100 Chancery Dr
- 102 Chancery Dr
- 104 Coventry Dr
- 3145 Salem Church Rd
- 201 Chancery Dr
- 102 Coventry Dr
- 3085 Salem Church Rd
- 105 Coventry Dr
- 3090 Salem Church Rd
- 200 Chancery Dr
- 3155 Salem Church Rd
- 203 Chancery Dr
- 334 Stoney Hill Rd
- 3075 Salem Church Rd
- 103 Coventry Dr
- 202 Chancery Dr
- 3163 Salem Church Rd
- 332 Stoney Hill Rd
- 205 Chancery Dr