Estimated Value: $363,640 - $430,000
Studio
--
Bath
--
Sq Ft
12,458
Sq Ft Lot
About This Home
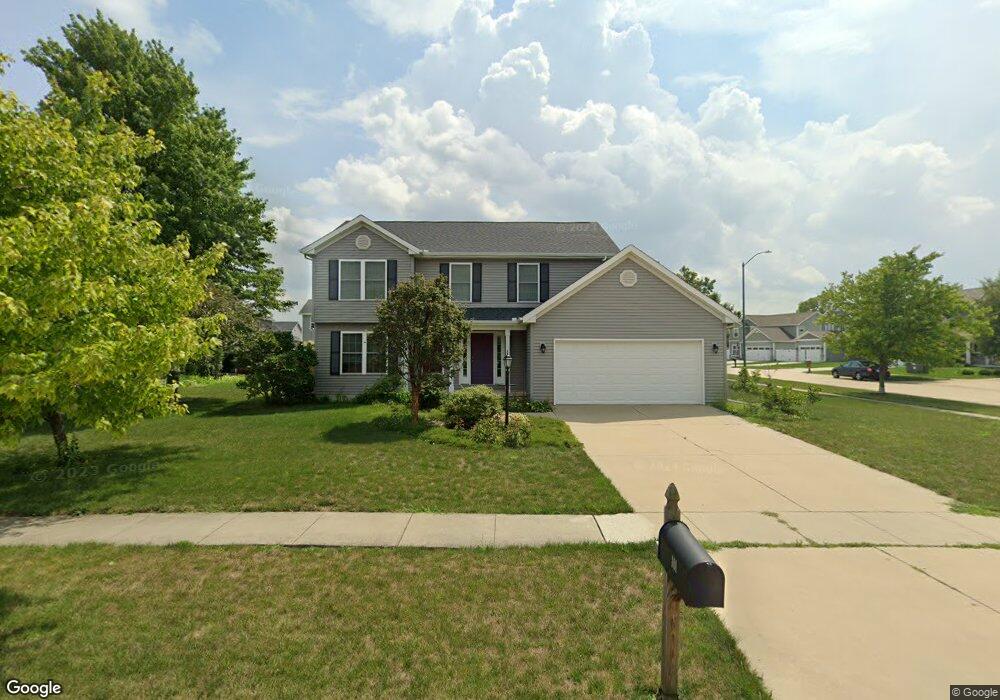
This home is located at 101 Clover St, Savoy, IL 61874 and is currently estimated at $395,410. 101 Clover St is a home located in Champaign County with nearby schools including Central High School, Montessori School of Champaign-Urbana, and University Primary School.
Ownership History
Date
Name
Owned For
Owner Type
Purchase Details
Closed on
Apr 23, 2021
Sold by
Hartman Van W and Hartman Carol B
Bought by
Hartman Carol B and The Carol B Hartman Declaratio
Current Estimated Value
Purchase Details
Closed on
May 12, 2004
Sold by
Ironwood Builders Inc
Bought by
Hartman Van W and Hartman Carol B
Home Financials for this Owner
Home Financials are based on the most recent Mortgage that was taken out on this home.
Original Mortgage
$160,000
Outstanding Balance
$76,860
Interest Rate
5.85%
Mortgage Type
Purchase Money Mortgage
Estimated Equity
$318,550
Purchase Details
Closed on
Dec 30, 2003
Sold by
Prairie Fields Lp
Bought by
Ironwood Builders Inc
Home Financials for this Owner
Home Financials are based on the most recent Mortgage that was taken out on this home.
Original Mortgage
$182,000
Interest Rate
5.75%
Mortgage Type
Construction
Create a Home Valuation Report for This Property
The Home Valuation Report is an in-depth analysis detailing your home's value as well as a comparison with similar homes in the area
Home Values in the Area
Average Home Value in this Area
Purchase History
| Date | Buyer | Sale Price | Title Company |
|---|---|---|---|
| Hartman Carol B | -- | Attorney | |
| Hartman Van W | -- | Attorney | |
| Hartman Van W | $219,000 | -- | |
| Ironwood Builders Inc | $43,000 | -- |
Source: Public Records
Mortgage History
| Date | Status | Borrower | Loan Amount |
|---|---|---|---|
| Open | Hartman Van W | $160,000 | |
| Previous Owner | Ironwood Builders Inc | $182,000 |
Source: Public Records
Tax History
| Year | Tax Paid | Tax Assessment Tax Assessment Total Assessment is a certain percentage of the fair market value that is determined by local assessors to be the total taxable value of land and additions on the property. | Land | Improvement |
|---|---|---|---|---|
| 2024 | $7,253 | $103,330 | $20,040 | $83,290 |
| 2023 | $7,253 | $95,410 | $18,500 | $76,910 |
| 2022 | $6,941 | $89,000 | $17,260 | $71,740 |
| 2021 | $6,779 | $87,420 | $16,950 | $70,470 |
| 2020 | $6,729 | $86,550 | $16,780 | $69,770 |
| 2019 | $6,519 | $85,100 | $16,500 | $68,600 |
| 2018 | $6,422 | $83,970 | $16,500 | $67,470 |
| 2017 | $6,230 | $81,270 | $16,500 | $64,770 |
| 2016 | $5,415 | $78,370 | $16,500 | $61,870 |
| 2015 | $5,470 | $78,370 | $16,500 | $61,870 |
| 2014 | $5,100 | $72,290 | $16,500 | $55,790 |
| 2013 | $5,017 | $72,290 | $16,500 | $55,790 |
Source: Public Records
Map
Nearby Homes
- 205 Gailardio
- 103 Calvin St
- 302 Jay St
- 612 N Clarendon Ct
- 402 Gentian
- 3 Lake Park Rd
- 106 Essex Ln Unit 4
- 309 Bluestem
- 312 London Way
- 313 London Way
- 302 Sutton St
- 505 Harpers Ferry
- 1409 Yorkshire Dr
- 407 Harpers Ferry
- 307 Harpers Ferry
- 305 Harpers Ferry
- 1010 Declaration Dr
- 409 Park Lane Dr
- 3906 Patriot Ln
- 3614 Freedom Blvd
- 103 Clover St
- 102 Cattail Ave
- 104 Cattail Ave
- 106 Cattail Ave
- 105 Clover St
- 102 Clover St
- 611 Bergamot St
- 609 Bergamot St
- 108 Cattail Ave
- 613 Bergamot St
- 107 Clover St
- 107 Clover St Unit 1
- 607 Bergamot St
- 104 Clover St
- 202 Cattail
- 106 Clover St
- 605 Bergamot St
- 109 Clover St
- 204 Cattail
- 103 Cattail Ave
Your Personal Tour Guide
Ask me questions while you tour the home.