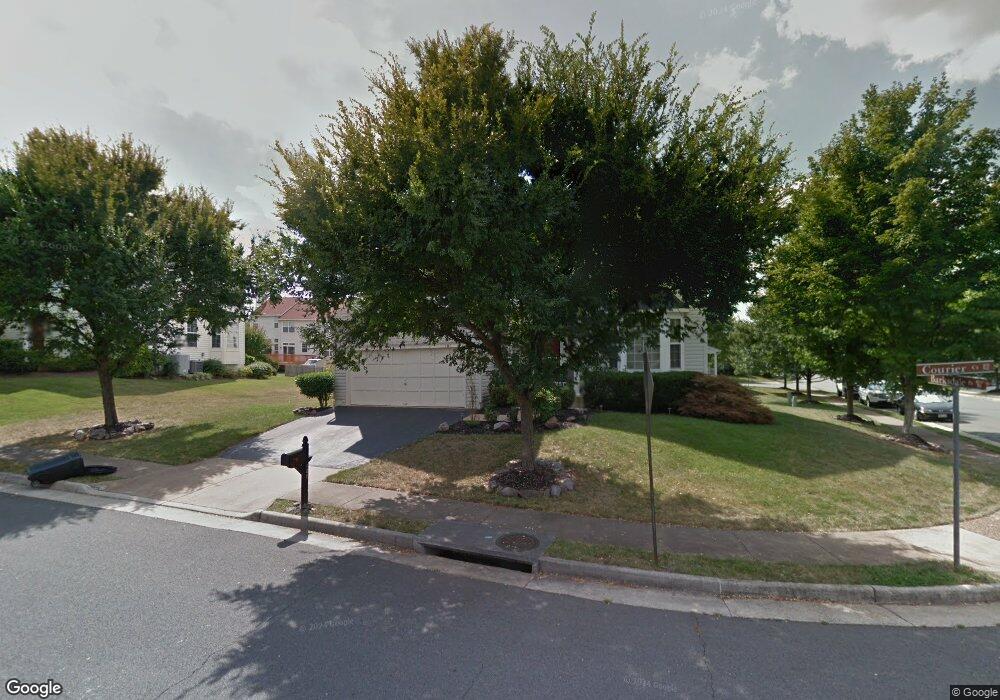
101 Courier Ct NE Leesburg, VA 20176
Estimated Value: $819,970 - $866,000
5
Beds
4
Baths
2,968
Sq Ft
$284/Sq Ft
Est. Value
About This Home
This home is located at 101 Courier Ct NE, Leesburg, VA 20176 and is currently estimated at $842,243, approximately $283 per square foot. 101 Courier Ct NE is a home located in Loudoun County with nearby schools including Ball's Bluff Elementary School, Smart's Mill Middle School, and Tuscarora High School.
Ownership History
Date
Name
Owned For
Owner Type
Purchase Details
Closed on
Jan 28, 2009
Sold by
U S Bank Natl Assn Tr
Bought by
Void Franklin D
Current Estimated Value
Home Financials for this Owner
Home Financials are based on the most recent Mortgage that was taken out on this home.
Original Mortgage
$343,660
Outstanding Balance
$216,769
Interest Rate
5.06%
Mortgage Type
FHA
Estimated Equity
$625,474
Purchase Details
Closed on
Mar 13, 2006
Sold by
Lewson Patrick
Bought by
Laing Don
Home Financials for this Owner
Home Financials are based on the most recent Mortgage that was taken out on this home.
Original Mortgage
$492,000
Interest Rate
6.26%
Mortgage Type
New Conventional
Purchase Details
Closed on
Jan 21, 1999
Sold by
Crossing Arcadia Potomac
Bought by
Best Lydia C
Home Financials for this Owner
Home Financials are based on the most recent Mortgage that was taken out on this home.
Original Mortgage
$213,350
Interest Rate
6.7%
Create a Home Valuation Report for This Property
The Home Valuation Report is an in-depth analysis detailing your home's value as well as a comparison with similar homes in the area
Home Values in the Area
Average Home Value in this Area
Purchase History
| Date | Buyer | Sale Price | Title Company |
|---|---|---|---|
| Void Franklin D | $350,000 | -- | |
| Laing Don | $615,000 | -- | |
| Best Lydia C | $224,610 | -- |
Source: Public Records
Mortgage History
| Date | Status | Borrower | Loan Amount |
|---|---|---|---|
| Open | Void Franklin D | $343,660 | |
| Previous Owner | Laing Don | $492,000 | |
| Previous Owner | Best Lydia C | $213,350 |
Source: Public Records
Tax History Compared to Growth
Tax History
| Year | Tax Paid | Tax Assessment Tax Assessment Total Assessment is a certain percentage of the fair market value that is determined by local assessors to be the total taxable value of land and additions on the property. | Land | Improvement |
|---|---|---|---|---|
| 2025 | $6,139 | $762,650 | $259,300 | $503,350 |
| 2024 | $6,063 | $700,890 | $239,300 | $461,590 |
| 2023 | $6,027 | $688,780 | $239,300 | $449,480 |
| 2022 | $5,706 | $641,120 | $229,300 | $411,820 |
| 2021 | $5,461 | $557,280 | $179,300 | $377,980 |
| 2020 | $5,147 | $497,340 | $179,300 | $318,040 |
| 2019 | $5,076 | $485,780 | $179,300 | $306,480 |
| 2018 | $5,082 | $468,420 | $149,300 | $319,120 |
| 2017 | $4,953 | $440,290 | $149,300 | $290,990 |
| 2016 | $4,938 | $431,230 | $0 | $0 |
| 2015 | $782 | $287,980 | $0 | $287,980 |
| 2014 | $764 | $268,230 | $0 | $268,230 |
Source: Public Records
Map
Nearby Homes
- 105 Burt Ct NE
- 732 Balls Bluff Rd NE
- 1411 Barksdale Dr NE
- 1204 James Rifle Ct NE
- 820 Ferndale Terrace NE
- 41966 Dry Hollow Rd
- 503 Richmond Square NE
- 815 Catoctin Cir NE
- 523 Currant Terrace NE
- 514 Covington Terrace NE
- 706 Amber Ct NE
- 1148 Keokuk Terrace NE
- 1129 Huntmaster Terrace NE Unit 301
- 1102 Huntmaster Terrace NE Unit 301
- 710 North St NE
- 903 Powhatan Ct NE
- 1616 Chickasaw Place NE
- 1636 Field Sparrow Terrace NE
- 1818 Woods Edge Dr NE
- 608 Blue Ridge Ave NE
- 103 Courier Ct NE
- 102 Stone Ct NE
- 104 Stone Ct NE
- 102 Courier Ct NE
- 1230 Barksdale Dr NE
- 1228 Barksdale Dr NE
- 106 Stone Ct NE
- 105 Courier Ct NE
- 1232 Barksdale Dr NE
- 104 Courier Ct NE
- 1226 Barksdale Dr NE
- 108 Stone Ct NE
- 106 Courier Ct NE
- 107 Courier Ct NE
- 101 Stone Ct NE
- 103 Stone Ct NE
- 101 Field Ct NE
- 1224 Barksdale Dr NE
- 103 Field Ct NE
- 1236 Barksdale Dr NE