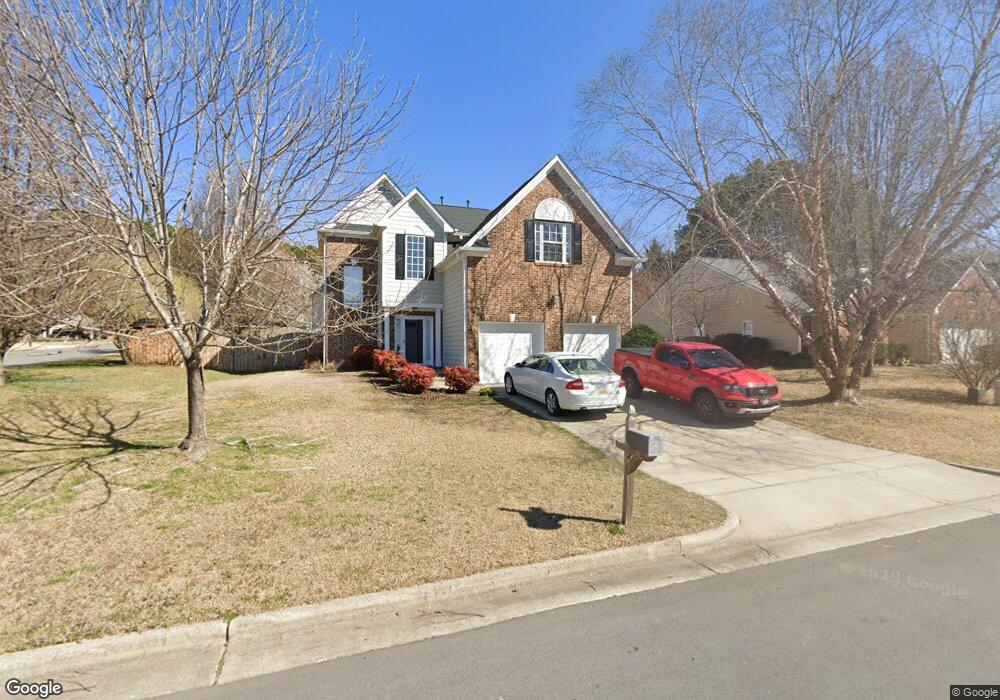
101 Cranwell Ct Apex, NC 27502
West Apex NeighborhoodEstimated Value: $517,000 - $560,000
3
Beds
3
Baths
2,166
Sq Ft
$248/Sq Ft
Est. Value
About This Home
This home is located at 101 Cranwell Ct, Apex, NC 27502 and is currently estimated at $538,114, approximately $248 per square foot. 101 Cranwell Ct is a home located in Wake County with nearby schools including Olive Chapel Elementary School, Lufkin Road Middle School, and Apex Friendship High School.
Ownership History
Date
Name
Owned For
Owner Type
Purchase Details
Closed on
Aug 1, 2007
Sold by
Evans Brian P and Evans Maria B
Bought by
Caudill John T and Caudill Kelly M
Current Estimated Value
Home Financials for this Owner
Home Financials are based on the most recent Mortgage that was taken out on this home.
Original Mortgage
$199,600
Outstanding Balance
$126,312
Interest Rate
6.65%
Mortgage Type
Purchase Money Mortgage
Estimated Equity
$411,802
Purchase Details
Closed on
Jul 13, 2004
Sold by
Sirva Relocation Llc
Bought by
Evans Brian P and Evans Maria B
Home Financials for this Owner
Home Financials are based on the most recent Mortgage that was taken out on this home.
Original Mortgage
$202,356
Interest Rate
6.25%
Mortgage Type
VA
Purchase Details
Closed on
Apr 18, 2002
Sold by
D R Horton Inc Torrey
Bought by
Bridges Jeremy S and Bridges Lisa H
Home Financials for this Owner
Home Financials are based on the most recent Mortgage that was taken out on this home.
Original Mortgage
$172,765
Interest Rate
6.89%
Create a Home Valuation Report for This Property
The Home Valuation Report is an in-depth analysis detailing your home's value as well as a comparison with similar homes in the area
Home Values in the Area
Average Home Value in this Area
Purchase History
| Date | Buyer | Sale Price | Title Company |
|---|---|---|---|
| Caudill John T | $249,500 | None Available | |
| Evans Brian P | $198,000 | -- | |
| Sirva Relocation Llc | $198,000 | -- | |
| Bridges Jeremy S | $182,000 | -- |
Source: Public Records
Mortgage History
| Date | Status | Borrower | Loan Amount |
|---|---|---|---|
| Open | Caudill John T | $199,600 | |
| Previous Owner | Sirva Relocation Llc | $202,356 | |
| Previous Owner | Bridges Jeremy S | $172,765 |
Source: Public Records
Tax History Compared to Growth
Tax History
| Year | Tax Paid | Tax Assessment Tax Assessment Total Assessment is a certain percentage of the fair market value that is determined by local assessors to be the total taxable value of land and additions on the property. | Land | Improvement |
|---|---|---|---|---|
| 2025 | $4,483 | $511,219 | $180,000 | $331,219 |
| 2024 | $4,383 | $511,219 | $180,000 | $331,219 |
| 2023 | $3,625 | $328,643 | $90,000 | $238,643 |
| 2022 | $3,403 | $328,643 | $90,000 | $238,643 |
| 2021 | $3,274 | $328,643 | $90,000 | $238,643 |
| 2020 | $3,241 | $328,643 | $90,000 | $238,643 |
| 2019 | $2,898 | $253,443 | $78,000 | $175,443 |
| 2018 | $2,730 | $253,443 | $78,000 | $175,443 |
| 2017 | $2,542 | $253,443 | $78,000 | $175,443 |
| 2016 | $2,505 | $253,443 | $78,000 | $175,443 |
| 2015 | $2,430 | $239,928 | $65,000 | $174,928 |
| 2014 | $2,343 | $239,928 | $65,000 | $174,928 |
Source: Public Records
Map
Nearby Homes
- 105 Grassy Ridge Ct
- 312 Brierridge Dr
- 202 Homestead Park Dr
- 505 Brickstone Dr
- 943 Homestead Park Dr
- 3916 Chapel Oak Dr
- 107 Checker Ct
- 2512 Livingston Ct
- 102 Checker Ct
- 1720 Ashley Downs Dr
- 2007 Winecott Dr
- 203 Chilcott Ln
- 1512 Piazzo Ct
- 109 Kinship Ln
- 1706 Patterson Grove Rd
- 3119 Cregler Dr
- 302 Kellyridge Dr
- 2006 Driskill Ct
- 2006 Jerimouth Dr
- 1112 Palisade Bluff Ln Unit Lot 6
- 103 Cranwell Ct
- 100 Bonhill Ct
- 908 Brickstone Dr
- 105 Cranwell Ct
- 102 Bonhill Ct
- 1003 Brickstone Dr
- 1001 Brickstone Dr
- 1005 Brickstone Dr
- 104 Bonhill Ct
- 907 Brickstone Dr
- 102 Cranwell Ct
- 107 Cranwell Ct
- 904 Brickstone Dr
- 1007 Brickstone Dr
- 104 Cranwell Ct
- 905 Brickstone Dr
- 106 Bonhill Ct
- 109 Cranwell Ct
- 106 Cranwell Ct
- 113 Brierridge Dr