Estimated Value: $223,000 - $298,000
2
Beds
1
Bath
908
Sq Ft
$286/Sq Ft
Est. Value
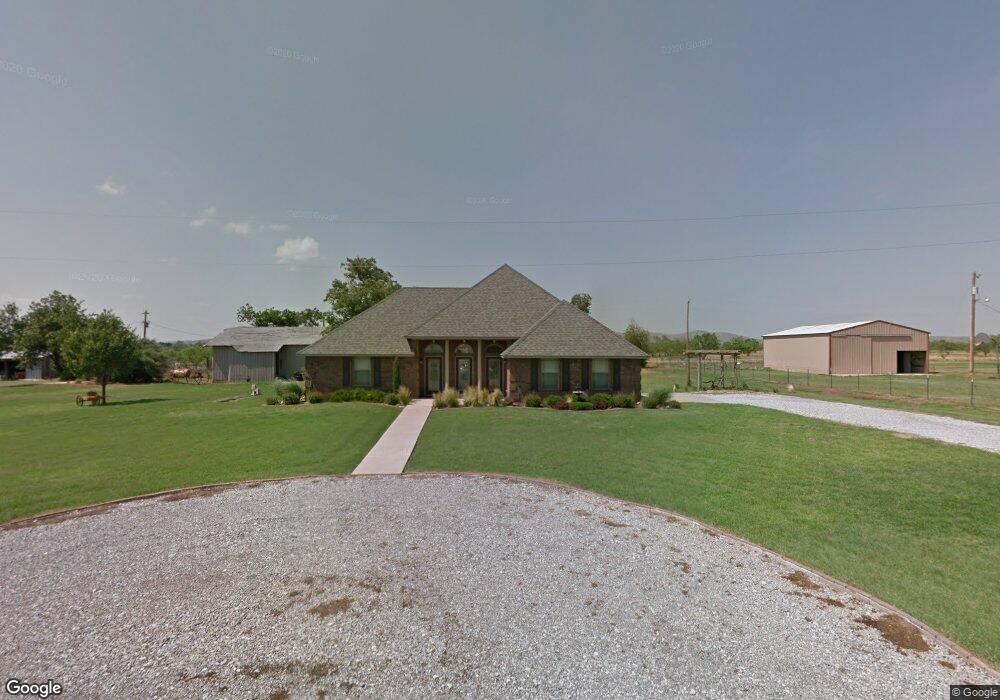
About This Home
This home is located at 101 Deacons Row, Cache, OK 73527 and is currently estimated at $259,255, approximately $285 per square foot. 101 Deacons Row is a home located in Comanche County with nearby schools including Cache Primary Elementary School, Cache Intermediate Elementary School, and Cache Middle School.
Ownership History
Date
Name
Owned For
Owner Type
Purchase Details
Closed on
Mar 28, 2022
Sold by
Parker Staggs James and Parker Marie Jennifer
Bought by
Ferguson-Craig Janis Givens and Craig Tommy Joe
Current Estimated Value
Home Financials for this Owner
Home Financials are based on the most recent Mortgage that was taken out on this home.
Original Mortgage
$166,107
Outstanding Balance
$152,253
Interest Rate
4.42%
Mortgage Type
New Conventional
Estimated Equity
$107,002
Purchase Details
Closed on
Jan 3, 2020
Sold by
Marshall Randy G and Marshall Alisa M
Bought by
Staggs James Parker and Staggs Jennifer Marie
Purchase Details
Closed on
Nov 22, 2019
Sold by
Stoll Dan and Stoll Patricia Ann
Bought by
Marshall Alisa Machelle
Purchase Details
Closed on
Jan 26, 2018
Sold by
Kriss Charles E and Kriss Donna G
Bought by
Marshall Randy G and Marshall Alisa M
Create a Home Valuation Report for This Property
The Home Valuation Report is an in-depth analysis detailing your home's value as well as a comparison with similar homes in the area
Home Values in the Area
Average Home Value in this Area
Purchase History
| Date | Buyer | Sale Price | Title Company |
|---|---|---|---|
| Ferguson-Craig Janis Givens | $180,000 | Sovereign Title | |
| Staggs James Parker | $155,000 | Sovereign Title Services | |
| Marshall Alisa Machelle | -- | None Available | |
| Marshall Randy G | -- | Southwest Abstract & Title C |
Source: Public Records
Mortgage History
| Date | Status | Borrower | Loan Amount |
|---|---|---|---|
| Open | Ferguson-Craig Janis Givens | $166,107 |
Source: Public Records
Tax History
| Year | Tax Paid | Tax Assessment Tax Assessment Total Assessment is a certain percentage of the fair market value that is determined by local assessors to be the total taxable value of land and additions on the property. | Land | Improvement |
|---|---|---|---|---|
| 2025 | $4,250 | $40,955 | $1,553 | $39,402 |
| 2024 | $2,052 | $20,021 | $1,553 | $18,468 |
| 2023 | $2,052 | $20,021 | $1,553 | $18,468 |
| 2022 | $2,121 | $18,848 | $1,553 | $17,295 |
| 2021 | $1,698 | $18,217 | $1,553 | $16,664 |
| 2020 | $1,830 | $18,049 | $1,553 | $16,496 |
| 2019 | $2,042 | $20,017 | $1,553 | $18,464 |
| 2018 | $2,100 | $20,356 | $1,553 | $18,803 |
| 2017 | $1,967 | $19,693 | $672 | $19,021 |
| 2016 | $1,957 | $19,939 | $672 | $19,267 |
| 2015 | $1,860 | $18,990 | $672 | $18,318 |
| 2014 | $1,748 | $18,085 | $672 | $17,413 |
Source: Public Records
Map
Nearby Homes
- 207 & 1/2 N Crater Creek Rd
- 209 E B Ave
- 118 N Elk Dr
- 433 NE Creekside Dr
- 206 NW Granite Ave
- 817 Hummingbird Dr
- 206 W C Ave
- 207 C Ave
- 205 NW Cherry Ave
- 405 N Mountain Meadow Dr
- 214 NW Sandstone Ave
- 207 Pine Ave
- 205 Pine Ave
- 206 Pine Ave
- 112 NW Elm Ave
- 108 NW Elm Ave
- 111 S 6th St
- 703 SW 6th
- 104 NW Elm Ave
- 815 W D Ave
- 103 Deacons Row
- 202 N Crater Creek Rd
- 105 Deacons Row
- 203 N Crater Creek Rd
- 93 NW Crater Creek Rd
- 205 N Crater Creek Rd
- 1134 NW Airport Rd
- 705 NW Crater Creek Rd
- 201 N Crater Creek Rd
- 107 Deacons Row
- 117 N Crater Creek Rd
- 207 1/2 N Crater Creek Rd
- 207 N Crater Creek Rd
- 118 Crater Creek Rd
- 1 Tibbs Dr
- 111 N Crater Creek Rd
- 118 N Crater Creek Rd
- 113 N Crater Creek Rd
- 213 E B Ave
- 116 N Crater Creek Rd
Your Personal Tour Guide
Ask me questions while you tour the home.