101 Deer Walk Trail Talking Rock, GA 30175
Estimated Value: $834,000 - $1,196,000
7
Beds
7
Baths
6,118
Sq Ft
$167/Sq Ft
Est. Value
About This Home
This home is located at 101 Deer Walk Trail, Talking Rock, GA 30175 and is currently estimated at $1,021,385, approximately $166 per square foot. 101 Deer Walk Trail is a home located in Gilmer County with nearby schools including Ellijay Elementary School, Gilmer Middle School, and Clear Creek Elementary School.
Ownership History
Date
Name
Owned For
Owner Type
Purchase Details
Closed on
Feb 5, 2010
Sold by
Chadwick Justin A
Bought by
Chadwick Justin A and Chadwick Joyce M
Current Estimated Value
Home Financials for this Owner
Home Financials are based on the most recent Mortgage that was taken out on this home.
Original Mortgage
$378,000
Outstanding Balance
$250,672
Interest Rate
5.07%
Mortgage Type
New Conventional
Estimated Equity
$770,713
Purchase Details
Closed on
Jul 9, 2008
Sold by
Gorman Stephen E
Bought by
Chadwick Justin A
Home Financials for this Owner
Home Financials are based on the most recent Mortgage that was taken out on this home.
Original Mortgage
$380,000
Interest Rate
6.27%
Mortgage Type
New Conventional
Purchase Details
Closed on
Jan 1, 2007
Sold by
Gorman Stephen E and Gorman S
Bought by
Gorman Stephen E
Purchase Details
Closed on
Nov 30, 1999
Sold by
Mountain Creek Hollo
Bought by
Gorman Stephen E and Gorman S
Create a Home Valuation Report for This Property
The Home Valuation Report is an in-depth analysis detailing your home's value as well as a comparison with similar homes in the area
Home Values in the Area
Average Home Value in this Area
Purchase History
| Date | Buyer | Sale Price | Title Company |
|---|---|---|---|
| Chadwick Justin A | -- | -- | |
| Chadwick Justin A | $475,000 | -- | |
| Gorman Stephen E | $900,000 | -- | |
| Gorman Stephen E | $32,000 | -- |
Source: Public Records
Mortgage History
| Date | Status | Borrower | Loan Amount |
|---|---|---|---|
| Open | Chadwick Justin A | $378,000 | |
| Previous Owner | Chadwick Justin A | $380,000 |
Source: Public Records
Tax History Compared to Growth
Tax History
| Year | Tax Paid | Tax Assessment Tax Assessment Total Assessment is a certain percentage of the fair market value that is determined by local assessors to be the total taxable value of land and additions on the property. | Land | Improvement |
|---|---|---|---|---|
| 2024 | $5,180 | $409,552 | $20,040 | $389,512 |
| 2023 | $5,219 | $396,520 | $8,000 | $388,520 |
| 2022 | $5,382 | $358,000 | $8,800 | $349,200 |
| 2021 | $5,090 | $281,620 | $10,000 | $271,620 |
| 2020 | $4,875 | $236,640 | $10,000 | $226,640 |
| 2019 | $5,015 | $236,640 | $10,000 | $226,640 |
| 2018 | $4,565 | $211,560 | $10,000 | $201,560 |
| 2017 | $4,662 | $196,000 | $10,000 | $186,000 |
| 2016 | $4,794 | $198,080 | $10,000 | $188,080 |
| 2015 | $4,334 | $177,720 | $10,000 | $167,720 |
| 2014 | $4,435 | $175,000 | $10,000 | $165,000 |
| 2013 | -- | $179,680 | $10,000 | $169,680 |
Source: Public Records
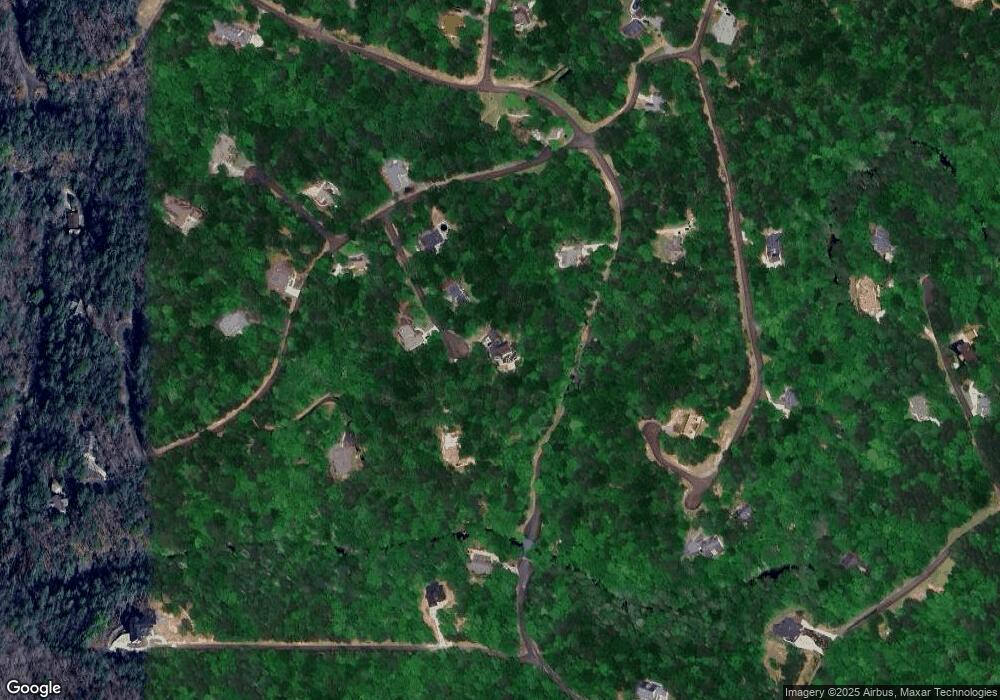
Map
Nearby Homes
- 72 Mountain Creek Hollow Dr
- 4.7AC Mountain Creek Hollow Dr
- LT104 Mountain Creek Hollow Dr
- Lot 104 Mountain Creek Hollow Dr
- 103R Mountain Creek Hollow Dr
- Lot 103R Mountain Creek Hollow Dr
- 23 Fox Trail Ct
- Lot 23 Fox Trail Ct
- 0 Bear Creek Rd Unit 414593
- 0 Bear Creek Rd Unit 10495290
- 0 Bear Creek Rd Unit 7555375
- 0 Trout Line Ct Unit 10545615
- 0 Trout Line Ct Unit 7595244
- Lot 244 Spear Point Dr
- 0 Coffee Mill Run Unit 10565823
- 0 Coffee Mill Run Unit 7616493
- 240 Mountain Creek Hollow Dr Unit 55
- 240 Mountain Creek Hollow Dr
- 185 Country Rd
- 71 Mountain Creek Hollow Dr
- 57 Deer Walk Trail
- 907 Mountain Creek Hollow Dr
- 72 Deer Walk Trail
- LT 27 Mountain Crk Hollow
- LT 27 Mountain Creek Hollo
- 106 Deer Walk Trail
- 133 Deer Walk Trail
- 87 Mountain Creek Hollow Dr
- 101 Mountain Creek Hollow Dr
- LOT169 Mountain Creek Hollow Dr
- 69 Mountain Creek Hollow Dr
- Lot 73 Mountain Creek Hollow Dr
- Lot 27 Mountain Creek Hollow Dr
- Lot 28 Mountain Creek Hollow Dr
- Lot 101R Mountain Creek Hollow Dr Unit 101
- LT103R Mountain Creek Hollow Dr
- 96/97 Mountain Creek Hollow Dr
- 1.06 Mountain Creek Hollow Dr
- LT 69 Mountain Creek Hollow Dr
- 2.59A Mountain Creek Hollow Dr