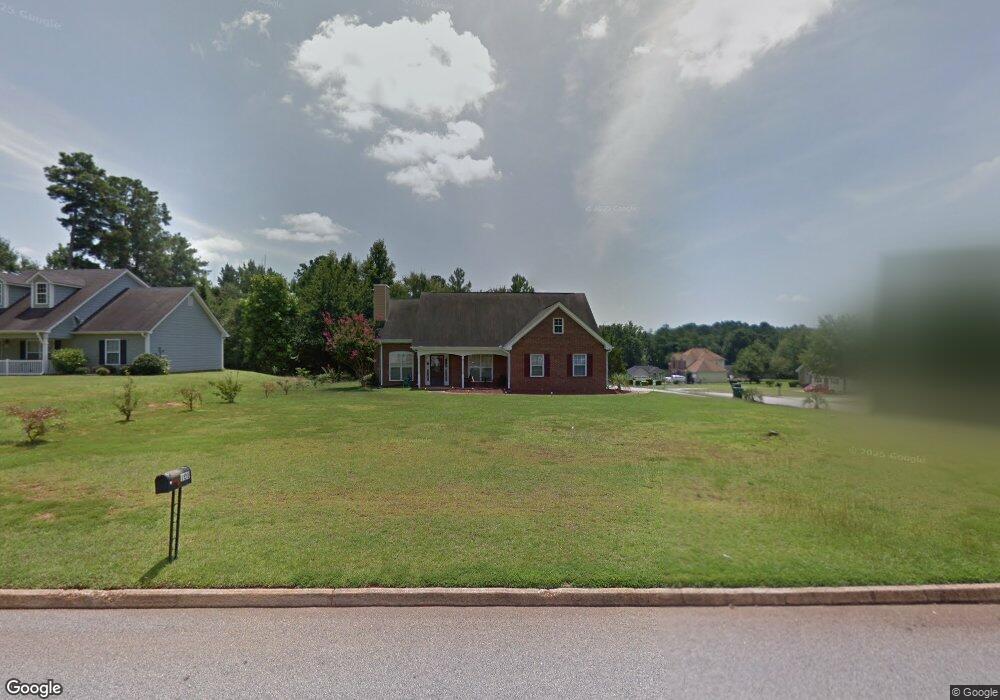
101 Derby Dr Unit 3 Griffin, GA 30224
Spalding County NeighborhoodEstimated Value: $212,000 - $252,000
3
Beds
2
Baths
1,420
Sq Ft
$165/Sq Ft
Est. Value
About This Home
This home is located at 101 Derby Dr Unit 3, Griffin, GA 30224 and is currently estimated at $234,197, approximately $164 per square foot. 101 Derby Dr Unit 3 is a home located in Spalding County with nearby schools including Orrs Elementary School, Carver Road Middle School, and Griffin High School.
Ownership History
Date
Name
Owned For
Owner Type
Purchase Details
Closed on
Nov 26, 2014
Sold by
Pilkenton Murray Llc
Bought by
Dragg Pamela F
Current Estimated Value
Home Financials for this Owner
Home Financials are based on the most recent Mortgage that was taken out on this home.
Original Mortgage
$86,406
Outstanding Balance
$65,769
Interest Rate
3.75%
Mortgage Type
FHA
Estimated Equity
$168,428
Purchase Details
Closed on
Jul 1, 2014
Sold by
Lipsizt Ron
Bought by
Pilkenton Murray Llc
Purchase Details
Closed on
Dec 31, 2004
Sold by
Melton Betty M
Bought by
Moore Steve W
Home Financials for this Owner
Home Financials are based on the most recent Mortgage that was taken out on this home.
Original Mortgage
$15,507
Interest Rate
5.63%
Mortgage Type
New Conventional
Purchase Details
Closed on
Jun 26, 2003
Sold by
Melton Hugh E
Bought by
Shivers Carl C
Purchase Details
Closed on
Jan 30, 1997
Sold by
Pilkentonremodeling Const
Bought by
Melton Betty
Purchase Details
Closed on
Feb 19, 1993
Sold by
Motift Inc
Bought by
Hawkins Partners Lp
Purchase Details
Closed on
Aug 4, 1992
Sold by
Landrum & Morris Inc
Bought by
Motift Inc
Create a Home Valuation Report for This Property
The Home Valuation Report is an in-depth analysis detailing your home's value as well as a comparison with similar homes in the area
Home Values in the Area
Average Home Value in this Area
Purchase History
| Date | Buyer | Sale Price | Title Company |
|---|---|---|---|
| Dragg Pamela F | $88,000 | -- | |
| Pilkenton Murray Llc | $34,543 | -- | |
| Moore Steve W | $15,000 | -- | |
| Shivers Carl C | $121,900 | -- | |
| Melton Betty | $94,000 | -- | |
| Hawkins Partners Lp | $150,000 | -- | |
| Motift Inc | -- | -- |
Source: Public Records
Mortgage History
| Date | Status | Borrower | Loan Amount |
|---|---|---|---|
| Open | Dragg Pamela F | $86,406 | |
| Previous Owner | Moore Steve W | $15,507 |
Source: Public Records
Tax History Compared to Growth
Tax History
| Year | Tax Paid | Tax Assessment Tax Assessment Total Assessment is a certain percentage of the fair market value that is determined by local assessors to be the total taxable value of land and additions on the property. | Land | Improvement |
|---|---|---|---|---|
| 2024 | $2,700 | $73,004 | $10,120 | $62,884 |
| 2023 | $2,700 | $69,305 | $10,120 | $59,185 |
| 2022 | $2,234 | $58,251 | $8,800 | $49,451 |
| 2021 | $2,112 | $55,192 | $7,920 | $47,272 |
| 2020 | $1,501 | $39,919 | $7,200 | $32,719 |
| 2019 | $1,282 | $33,842 | $7,200 | $26,642 |
| 2018 | $1,377 | $32,591 | $7,200 | $25,391 |
| 2017 | $1,295 | $31,321 | $7,200 | $24,121 |
| 2016 | $1,084 | $25,820 | $7,200 | $18,620 |
| 2015 | $1,102 | $25,820 | $7,200 | $18,620 |
| 2014 | $1,136 | $25,820 | $7,200 | $18,620 |
Source: Public Records
Map
Nearby Homes
- 1723 Carrington Dr
- 1721 Carrington Dr
- 1707 Carrington Dr
- 1705 Carrington Dr
- 424 S Pine Hill Rd Unit 1
- 1850 Carrington Dr
- 711 S Pine Hill Rd
- 1740 Summerwoods Ln
- 733 S Pine Hill Rd
- 117 Mixon St
- 1663 Piedmont Rd
- 1169 W Poplar St
- 203 Ashley Dr
- 1776 Cheryl Ave
- 1611 Piedmont Rd
- 1610 Williamson Rd
- 450 Carver Rd
- 450 Carver
- 1729 Mary Ave
- 501 Oak Grove Rd
- 103 Derby Dr
- 140 Coach Dr
- 141 Coach Dr
- 134 Coach Dr
- 139 Coach Dr Unit 3
- 143 Coach Dr Unit 3
- 111 Chariot Dr
- 137 Coach Dr
- 113 Chariot Dr Unit III
- 121 Chariot Dr
- 119 Chariot Dr
- 132 Coach Dr
- 104 Derby Dr Unit III
- 115 Chariot Dr Unit III
- 0 Chariot Dr Unit 7369251
- 0 Chariot Dr Unit 7342645
- 0 Chariot Dr Unit 8835951
- 0 Chariot Dr Unit 8836686
- 0 Chariot Dr Unit 8425549
- 0 Chariot Dr Unit 8077441