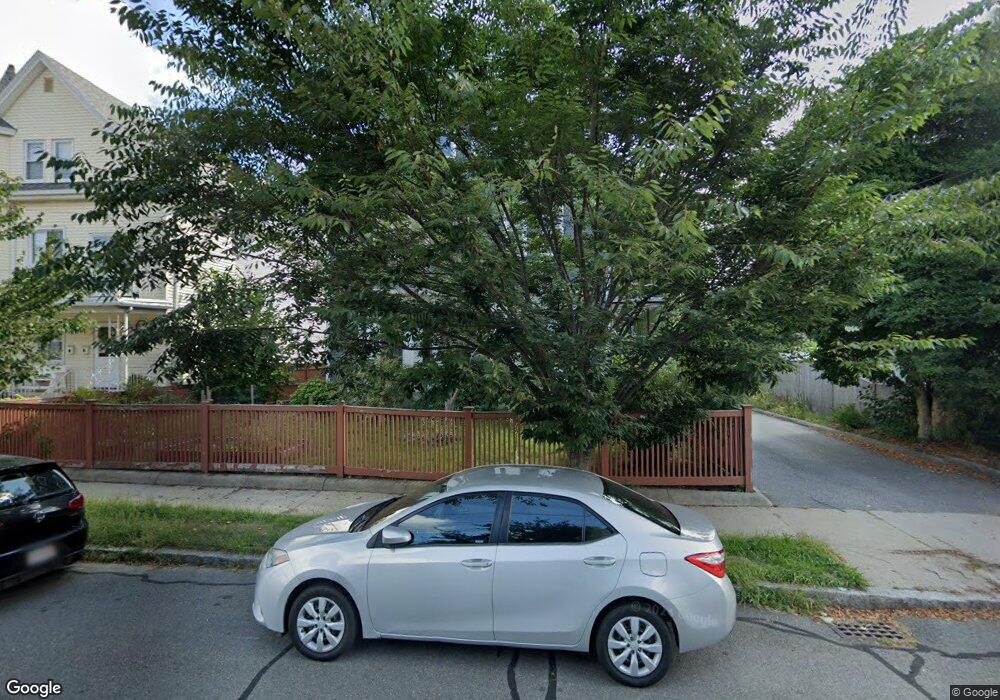
101 Dudley St Medford, MA 02155
Glenwood NeighborhoodEstimated Value: $1,113,000 - $1,544,000
5
Beds
3
Baths
3,414
Sq Ft
$369/Sq Ft
Est. Value
About This Home
This home is located at 101 Dudley St, Medford, MA 02155 and is currently estimated at $1,259,801, approximately $369 per square foot. 101 Dudley St is a home located in Middlesex County with nearby schools including Medford High School, Mystic Valley Regional Charter School, and St. Joseph School.
Ownership History
Date
Name
Owned For
Owner Type
Purchase Details
Closed on
May 17, 2011
Sold by
Ryan Karen A
Bought by
Roeper Stefanie and Sharpless William
Current Estimated Value
Home Financials for this Owner
Home Financials are based on the most recent Mortgage that was taken out on this home.
Original Mortgage
$363,810
Outstanding Balance
$252,831
Interest Rate
4.88%
Mortgage Type
Purchase Money Mortgage
Estimated Equity
$1,006,970
Create a Home Valuation Report for This Property
The Home Valuation Report is an in-depth analysis detailing your home's value as well as a comparison with similar homes in the area
Home Values in the Area
Average Home Value in this Area
Purchase History
| Date | Buyer | Sale Price | Title Company |
|---|---|---|---|
| Roeper Stefanie | $454,763 | -- |
Source: Public Records
Mortgage History
| Date | Status | Borrower | Loan Amount |
|---|---|---|---|
| Open | Roeper Stefanie | $363,810 |
Source: Public Records
Tax History
| Year | Tax Paid | Tax Assessment Tax Assessment Total Assessment is a certain percentage of the fair market value that is determined by local assessors to be the total taxable value of land and additions on the property. | Land | Improvement |
|---|---|---|---|---|
| 2025 | $8,353 | $949,200 | $403,500 | $545,700 |
| 2024 | $7,849 | $921,300 | $384,300 | $537,000 |
| 2023 | $7,476 | $864,300 | $359,200 | $505,100 |
| 2022 | $7,337 | $814,300 | $326,600 | $487,700 |
| 2021 | $7,066 | $750,900 | $311,100 | $439,800 |
| 2020 | $6,934 | $755,300 | $311,100 | $444,200 |
| 2019 | $6,666 | $694,400 | $282,900 | $411,500 |
| 2018 | $6,580 | $642,600 | $257,200 | $385,400 |
| 2017 | $6,517 | $617,100 | $240,400 | $376,700 |
| 2016 | $5,992 | $535,500 | $218,500 | $317,000 |
| 2015 | $5,751 | $491,500 | $208,100 | $283,400 |
Source: Public Records
Map
Nearby Homes
- 87 Otis St Unit 2
- 61 Dudley St
- 17 Court St Unit 17
- 240 Salem St Unit 3B
- 32 Almont St Unit 32-1
- 16 Walker St Unit 16
- 411 Salem St Unit 1
- 45 Cross St Unit 19
- 66 Almont St
- 236 Fellsway W
- 17 Abbott St
- 10 Chipman St Unit 10
- 50 Water St Unit 21
- 50 Water St Unit 24
- 52 Woodrow Ave Unit 1
- 59-65 Valley St Unit 4G
- 115 Emerald St
- 117 Emerald St Unit 117
- 500 Salem St Unit 307
- 59 Myrtle St
Your Personal Tour Guide
Ask me questions while you tour the home.