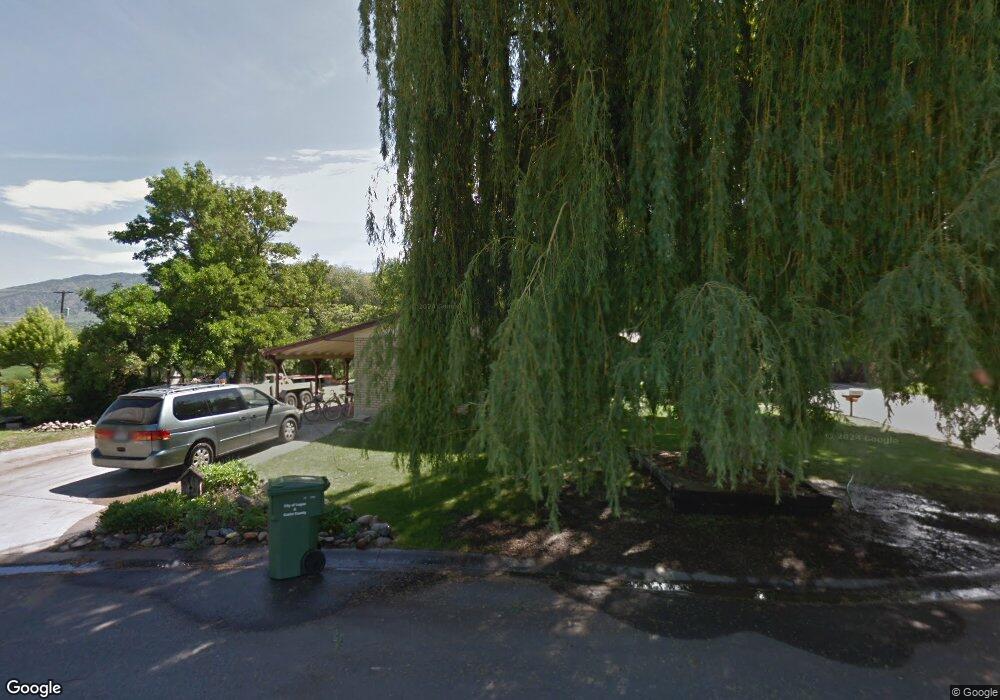
101 E 3700 S Nibley, UT 84321
Estimated Value: $424,000 - $483,000
4
Beds
3
Baths
2,500
Sq Ft
$182/Sq Ft
Est. Value
About This Home
This home is located at 101 E 3700 S, Nibley, UT 84321 and is currently estimated at $455,700, approximately $182 per square foot. 101 E 3700 S is a home located in Cache County with nearby schools including Heritage School, Spring Creek Middle School, and South Cache Middle School.
Ownership History
Date
Name
Owned For
Owner Type
Purchase Details
Closed on
Aug 9, 2017
Sold by
Smith Samuel David and Smith John Anthony
Bought by
Wiberg Jacob and Wiberg Shalise
Current Estimated Value
Home Financials for this Owner
Home Financials are based on the most recent Mortgage that was taken out on this home.
Original Mortgage
$199,786
Outstanding Balance
$165,897
Interest Rate
3.87%
Mortgage Type
FHA
Estimated Equity
$289,803
Purchase Details
Closed on
Aug 22, 2006
Sold by
Smith Edith E and Smith Samuel D
Bought by
Wiberg Jacob C and Wiberg Shalise W
Home Financials for this Owner
Home Financials are based on the most recent Mortgage that was taken out on this home.
Original Mortgage
$4,500
Interest Rate
6.76%
Mortgage Type
Stand Alone Second
Create a Home Valuation Report for This Property
The Home Valuation Report is an in-depth analysis detailing your home's value as well as a comparison with similar homes in the area
Home Values in the Area
Average Home Value in this Area
Purchase History
| Date | Buyer | Sale Price | Title Company |
|---|---|---|---|
| Wiberg Jacob | -- | Hickman Land Title Company | |
| Wiberg Jacob C | -- | American Secure Title |
Source: Public Records
Mortgage History
| Date | Status | Borrower | Loan Amount |
|---|---|---|---|
| Open | Wiberg Jacob | $199,786 | |
| Previous Owner | Wiberg Jacob C | $4,500 | |
| Previous Owner | Wiberg Jacob C | $150,868 |
Source: Public Records
Tax History
| Year | Tax Paid | Tax Assessment Tax Assessment Total Assessment is a certain percentage of the fair market value that is determined by local assessors to be the total taxable value of land and additions on the property. | Land | Improvement |
|---|---|---|---|---|
| 2025 | $1,722 | $228,285 | $0 | $0 |
| 2024 | $1,825 | $227,150 | $0 | $0 |
| 2023 | $1,923 | $224,090 | $0 | $0 |
| 2022 | $2,002 | $224,090 | $0 | $0 |
| 2021 | $1,902 | $330,720 | $75,000 | $255,720 |
| 2020 | $1,740 | $288,100 | $75,000 | $213,100 |
| 2019 | $1,581 | $249,451 | $75,000 | $174,451 |
| 2018 | $1,295 | $199,340 | $51,500 | $147,840 |
| 2017 | $1,237 | $100,925 | $0 | $0 |
| 2016 | $1,251 | $100,925 | $0 | $0 |
| 2015 | $1,243 | $100,925 | $0 | $0 |
| 2014 | $1,079 | $89,625 | $0 | $0 |
| 2013 | -- | $93,475 | $0 | $0 |
Source: Public Records
Map
Nearby Homes
- 4009 S Cottonwoods Ct
- 3923 Hillside Dr
- 271 W 2975 S Unit 725
- 271 W 2975 S
- 278 W 3400 S Unit 10
- 294 W 3400 S Unit 9
- 308 W 3400 S Unit 8
- 338 W 3400 S Unit 6
- 396 W 3650 S
- 267 W 2975 S Unit 726
- 174 W 3175 S
- 174 W 3175 S Unit 620
- 178 W 3175 S
- 186 W 3175 S
- 186 W 3175 S Unit 617
- 268 W 3400 S Unit 5
- 3085 S 225 W Unit G202
- 3085 S 225 W Unit G301
- 3085 S 225 W Unit 304
- 3085 S 225 W
Your Personal Tour Guide
Ask me questions while you tour the home.