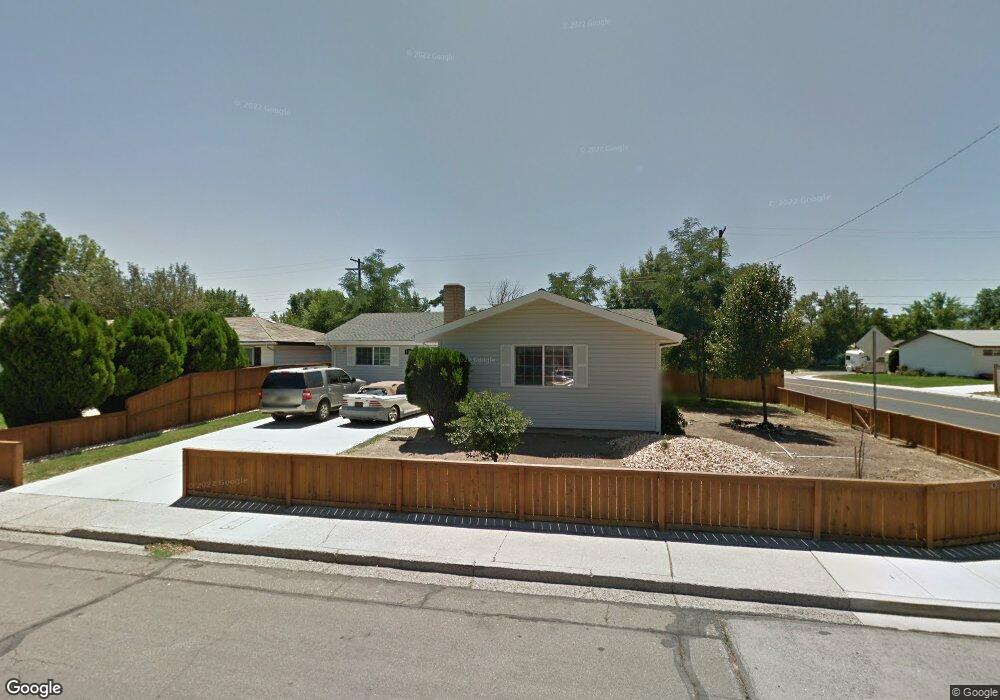
101 E Gault Way Sparks, NV 89431
McCarran Boulevard-Probasco NeighborhoodEstimated Value: $410,000 - $456,000
3
Beds
2
Baths
1,176
Sq Ft
$364/Sq Ft
Est. Value
About This Home
This home is located at 101 E Gault Way, Sparks, NV 89431 and is currently estimated at $428,573, approximately $364 per square foot. 101 E Gault Way is a home located in Washoe County with nearby schools including Florence Drake Elementary School, George L Dilworth Middle School, and Sparks High School.
Ownership History
Date
Name
Owned For
Owner Type
Purchase Details
Closed on
Aug 26, 1998
Sold by
Relocation Collaborative Services Inc
Bought by
Rivera Leonardo and Rivera Magdalena
Current Estimated Value
Home Financials for this Owner
Home Financials are based on the most recent Mortgage that was taken out on this home.
Original Mortgage
$117,853
Outstanding Balance
$23,290
Interest Rate
6.91%
Mortgage Type
FHA
Estimated Equity
$405,283
Purchase Details
Closed on
Mar 31, 1998
Sold by
Frazier Darnell
Bought by
Relocation Collaborative Services Inc
Purchase Details
Closed on
Jul 22, 1994
Sold by
Kimpan Anthony L and Kimpan Beckie L
Bought by
Frazier Darnell
Home Financials for this Owner
Home Financials are based on the most recent Mortgage that was taken out on this home.
Original Mortgage
$99,250
Interest Rate
8.51%
Create a Home Valuation Report for This Property
The Home Valuation Report is an in-depth analysis detailing your home's value as well as a comparison with similar homes in the area
Home Values in the Area
Average Home Value in this Area
Purchase History
| Date | Buyer | Sale Price | Title Company |
|---|---|---|---|
| Rivera Leonardo | $119,000 | Western Title Company Inc | |
| Relocation Collaborative Services Inc | $120,500 | -- | |
| Frazier Darnell | $104,500 | Western Title Company Inc |
Source: Public Records
Mortgage History
| Date | Status | Borrower | Loan Amount |
|---|---|---|---|
| Open | Rivera Leonardo | $117,853 | |
| Previous Owner | Frazier Darnell | $99,250 | |
| Closed | Rivera Leonardo | $4,160 |
Source: Public Records
Tax History
| Year | Tax Paid | Tax Assessment Tax Assessment Total Assessment is a certain percentage of the fair market value that is determined by local assessors to be the total taxable value of land and additions on the property. | Land | Improvement |
|---|---|---|---|---|
| 2026 | $609 | $54,251 | $34,090 | $20,161 |
| 2024 | $793 | $49,925 | $30,065 | $19,860 |
| 2023 | $771 | $49,622 | $31,325 | $18,297 |
| 2022 | $749 | $41,062 | $26,180 | $14,882 |
| 2021 | $727 | $32,368 | $17,955 | $14,413 |
| 2020 | $705 | $31,280 | $16,940 | $14,340 |
| 2019 | $684 | $29,463 | $15,890 | $13,573 |
| 2018 | $665 | $24,779 | $11,725 | $13,054 |
| 2017 | $646 | $23,438 | $10,395 | $13,043 |
| 2016 | $630 | $22,418 | $9,345 | $13,073 |
| 2015 | $629 | $20,659 | $7,700 | $12,959 |
| 2014 | $609 | $18,759 | $6,440 | $12,319 |
| 2013 | -- | $16,240 | $4,270 | $11,970 |
Source: Public Records
Map
Nearby Homes
- 91 E York Way
- 28 Arndell Way
- 3104 Sandy St
- 136 York Way Unit 1
- 25 E Penny Way
- 355 York Way
- 3188 Bristle Branch Dr
- 3198 Bristle Branch Dr
- 465 Lenwood Dr
- 343 Richards Way
- 8 E O St
- 908 Pinewood Dr
- 1940 4th St Unit 20
- 1940 4th St Unit 51
- 1940 4th St Unit 46
- 115 P St
- 14 E Greenbrae Dr
- 2455 Coppa Way
- 1945 4th St Unit 33
- 1945 4th St Unit 22
- 119 E Gault Way
- 2840 Probasco Way
- 129 E Gault Way
- 89 E Gault Way
- 2800 Probasco Way
- 100 E Gault Way
- 60 E Devere Way
- 2839 Tiffany Cir Unit 1B
- 120 E Gault Way
- 139 E Gault Way
- 2801 Tiffany Cir Unit 1B
- 90 E Gault Way
- 130 E Gault Way
- 59 E Gault Way
- 2790 Probasco Way
- 50 E Devere Way
- 39 E Gault Way
- 149 E Gault Way
- 2789 Probasco Way
- 140 E Gault Way
Your Personal Tour Guide
Ask me questions while you tour the home.