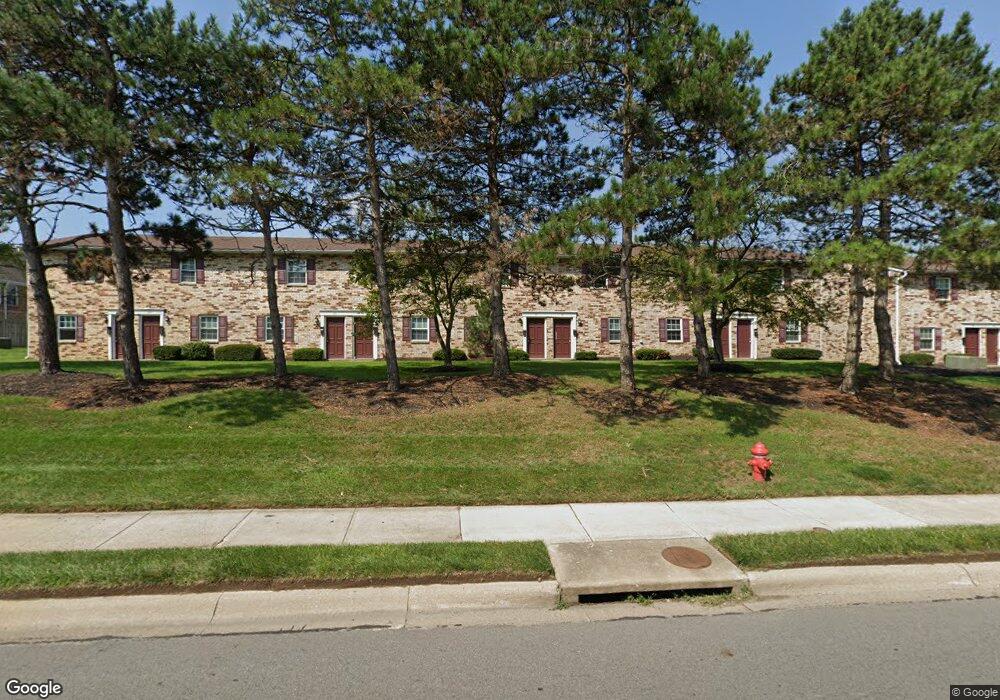
101 E Ticonderoga Dr Unit 11F Westerville, OH 43081
Estimated Value: $108,000 - $160,000
1
Bed
1
Bath
783
Sq Ft
$177/Sq Ft
Est. Value
About This Home
This home is located at 101 E Ticonderoga Dr Unit 11F, Westerville, OH 43081 and is currently estimated at $138,630, approximately $177 per square foot. 101 E Ticonderoga Dr Unit 11F is a home located in Franklin County with nearby schools including Annehurst Elementary School, Heritage Middle School, and Westerville South High School.
Ownership History
Date
Name
Owned For
Owner Type
Purchase Details
Closed on
Jul 23, 2015
Sold by
Walker Charity B
Bought by
Mwsc Llc
Current Estimated Value
Purchase Details
Closed on
Nov 15, 2013
Sold by
Hertlein John A
Bought by
Walker Charity B
Purchase Details
Closed on
Sep 29, 2011
Sold by
Walker Joseph E and Walker Charity B
Bought by
Hertlein John A
Purchase Details
Closed on
Jan 9, 2003
Sold by
Alexander Shawn M and Alexander Todd M
Bought by
Walker Joseph E and Walker Charity B
Purchase Details
Closed on
Mar 24, 1999
Sold by
Young John and Young Brenda
Bought by
Alexander Shawn M and Alexander Todd M
Purchase Details
Closed on
Mar 31, 1997
Sold by
Lipton William H
Bought by
Young John and Young Brenda
Purchase Details
Closed on
Oct 27, 1993
Create a Home Valuation Report for This Property
The Home Valuation Report is an in-depth analysis detailing your home's value as well as a comparison with similar homes in the area
Home Values in the Area
Average Home Value in this Area
Purchase History
| Date | Buyer | Sale Price | Title Company |
|---|---|---|---|
| Mwsc Llc | $37,500 | Attorney | |
| Walker Charity B | $42,000 | Talon Title | |
| Hertlein John A | $49,500 | Talon Group | |
| Walker Joseph E | $41,500 | -- | |
| Alexander Shawn M | $39,000 | Title First Agency Inc | |
| Young John | $34,500 | -- | |
| -- | $28,000 | -- |
Source: Public Records
Tax History Compared to Growth
Tax History
| Year | Tax Paid | Tax Assessment Tax Assessment Total Assessment is a certain percentage of the fair market value that is determined by local assessors to be the total taxable value of land and additions on the property. | Land | Improvement |
|---|---|---|---|---|
| 2024 | $2,354 | $40,460 | $10,850 | $29,610 |
| 2023 | $2,305 | $40,460 | $10,850 | $29,610 |
| 2022 | $1,777 | $23,810 | $4,100 | $19,710 |
| 2021 | $1,792 | $23,810 | $4,100 | $19,710 |
| 2020 | $1,787 | $23,810 | $4,100 | $19,710 |
| 2019 | $1,458 | $18,310 | $3,150 | $15,160 |
| 2018 | $1,379 | $18,310 | $3,150 | $15,160 |
| 2017 | $1,402 | $18,310 | $3,150 | $15,160 |
| 2016 | $1,369 | $15,890 | $2,520 | $13,370 |
| 2015 | $1,327 | $15,890 | $2,520 | $13,370 |
| 2014 | $1,328 | $15,890 | $2,520 | $13,370 |
| 2013 | $780 | $18,690 | $2,975 | $15,715 |
Source: Public Records
Map
Nearby Homes
- 101 W Ticonderoga Dr Unit B
- 106 E Ticonderoga Dr
- 106 E Ticonderoga Dr Unit A
- 774 W Main St
- 63 N West St
- 53 W College Ave
- 321 Pinnate Ln Unit Lot 1504
- 322 Pinnate Ln Unit Lot 1201
- 385 Hockberry Ave Unit Lot 1603
- 327 Pinnate Ln Unit Lot 1502
- 324 Pinnate Ln Unit Lot 1202
- 331 Pinnate Ln Unit Lot 1501
- 328 Pinnate Ln Unit Lot 1203
- 332 Pinnate Ln Unit Lot 1204
- Halston Plan at Towns on the Greenway
- Highwood with Loft Plan at Towns on the Greenway
- Halston with Loft Plan at Towns on the Greenway
- Highwood Plan at Towns on the Greenway
- 317 Vannette Ln Unit Lot 604
- 327 Vannette Ln Unit Lot 601
- 101 E Ticonderoga Dr Unit 3F
- 101 E Ticonderoga Dr Unit D
- 101 E Ticonderoga Dr Unit 9F
- 101 E Ticonderoga Dr Unit 15A
- 101 E Ticonderoga Dr Unit M
- 101 E Ticonderoga Dr Unit 6A
- 101 E Ticonderoga Dr Unit 1F
- 101 E Ticonderoga Dr
- 101 E Ticonderoga Dr Unit 8A
- 101 E Ticonderoga Dr
- 101 E Ticonderoga Dr Unit 7A
- 101 E Ticonderoga Dr
- 101 E Ticonderoga Dr
- 101 E Ticonderoga Dr
- 101 E Ticonderoga Dr Unit 2F
- 101 E Ticonderoga Dr Unit I
- 101 E Ticonderoga Dr Unit EC
- 101 E Ticonderoga Dr Unit A
- 101 E Ticonderoga Dr Unit G
- 101 E Ticonderoga Dr Unit H