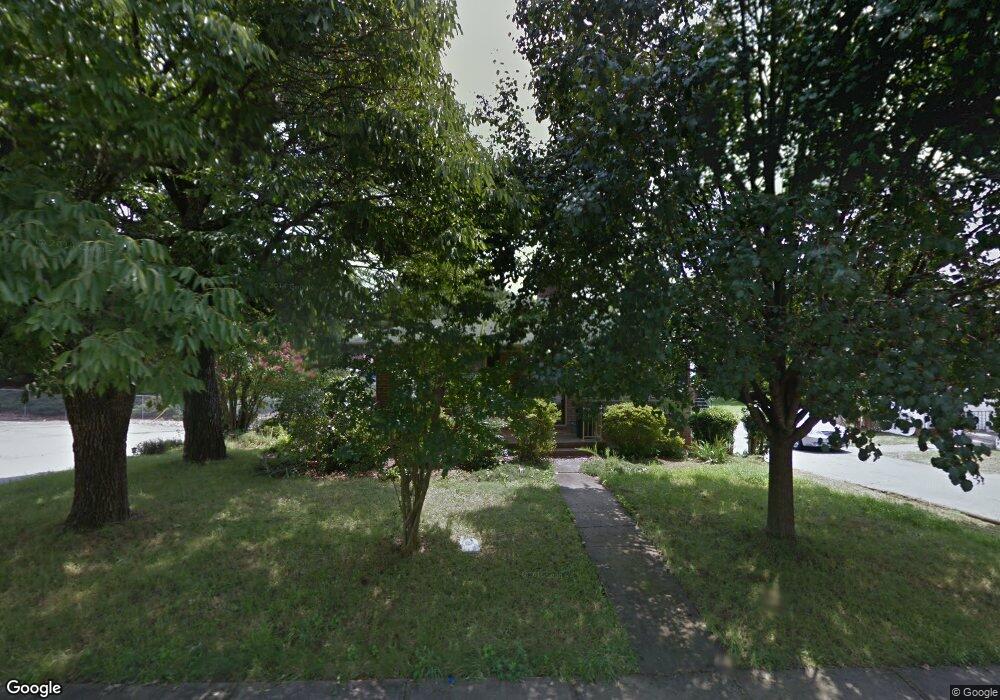
101 Evans St Morganton, NC 28655
Estimated Value: $251,000 - $311,000
2
Beds
2
Baths
1,765
Sq Ft
$155/Sq Ft
Est. Value
About This Home
This home is located at 101 Evans St, Morganton, NC 28655 and is currently estimated at $274,443, approximately $155 per square foot. 101 Evans St is a home located in Burke County with nearby schools including Walter R. Johnson Middle School, Freedom High School, and New Dimensions.
Ownership History
Date
Name
Owned For
Owner Type
Purchase Details
Closed on
May 6, 2013
Sold by
Smith Jonathan A and Smith Chandra N
Bought by
Mcpeters Barry Edwin
Current Estimated Value
Home Financials for this Owner
Home Financials are based on the most recent Mortgage that was taken out on this home.
Original Mortgage
$120,000
Outstanding Balance
$85,452
Interest Rate
3.59%
Mortgage Type
New Conventional
Estimated Equity
$188,991
Purchase Details
Closed on
Apr 29, 2008
Sold by
Baker Scott Eugene and Baker Kimberly Simmons
Bought by
Smith Jonathan A and Smith Chandra N
Home Financials for this Owner
Home Financials are based on the most recent Mortgage that was taken out on this home.
Original Mortgage
$143,300
Interest Rate
6.08%
Mortgage Type
Purchase Money Mortgage
Create a Home Valuation Report for This Property
The Home Valuation Report is an in-depth analysis detailing your home's value as well as a comparison with similar homes in the area
Home Values in the Area
Average Home Value in this Area
Purchase History
| Date | Buyer | Sale Price | Title Company |
|---|---|---|---|
| Mcpeters Barry Edwin | $120,000 | None Available | |
| Smith Jonathan A | $145,000 | None Available | |
| Smith Jonathan A | $145,000 | None Available |
Source: Public Records
Mortgage History
| Date | Status | Borrower | Loan Amount |
|---|---|---|---|
| Open | Mcpeters Barry Edwin | $120,000 | |
| Previous Owner | Smith Jonathan A | $143,300 |
Source: Public Records
Tax History
| Year | Tax Paid | Tax Assessment Tax Assessment Total Assessment is a certain percentage of the fair market value that is determined by local assessors to be the total taxable value of land and additions on the property. | Land | Improvement |
|---|---|---|---|---|
| 2025 | $1,040 | $169,897 | $9,516 | $160,381 |
| 2024 | $1,044 | $169,897 | $9,516 | $160,381 |
| 2023 | $1,039 | $169,897 | $9,516 | $160,381 |
| 2022 | $874 | $113,950 | $7,800 | $106,150 |
| 2021 | $868 | $113,950 | $7,800 | $106,150 |
| 2020 | $864 | $113,950 | $7,800 | $106,150 |
| 2019 | $864 | $113,950 | $7,800 | $106,150 |
| 2018 | $826 | $108,486 | $7,800 | $100,686 |
| 2017 | $824 | $108,486 | $7,800 | $100,686 |
| 2016 | $803 | $108,486 | $7,800 | $100,686 |
| 2015 | $800 | $108,486 | $7,800 | $100,686 |
| 2014 | $798 | $108,486 | $7,800 | $100,686 |
| 2013 | $828 | $108,486 | $7,800 | $100,686 |
Source: Public Records
Map
Nearby Homes
- 406 N Green St
- 118 W Union St Unit Suite A
- 118 W Union St Unit A
- 201 East Ave
- 214 Howard St
- VL E Concord St
- 308 E Concord St
- 430 N Green St
- 302 White St
- 202 Clark St
- 105 Moses St
- 404 Huffman St
- 218 Davis Dr
- 507 S College St
- 315 W Mcdowell St
- 231 Davis Dr
- 212 Riverside Dr
- 142 Pearson Dr
- 135 Hilltop St
- 0 Riverside Dr
- 103 Evans St Unit 105
- 605 Mull St Unit 607
- 603 Mull St
- 102 Evans St
- 104 Evans St
- 107 Evans St Unit 109
- 106 Evans St
- 100 Cascade St
- 104 Cascade St
- 111 Evans St
- 106 Cascade St
- 105 Morehead St
- 107 Morehead St
- 110 Evans St
- 109 Morehead St
- 307 Avery Ave
- 113 Evans St
- 111 Morehead St
- 101 Cascade St
- 108 Cascade St
Your Personal Tour Guide
Ask me questions while you tour the home.