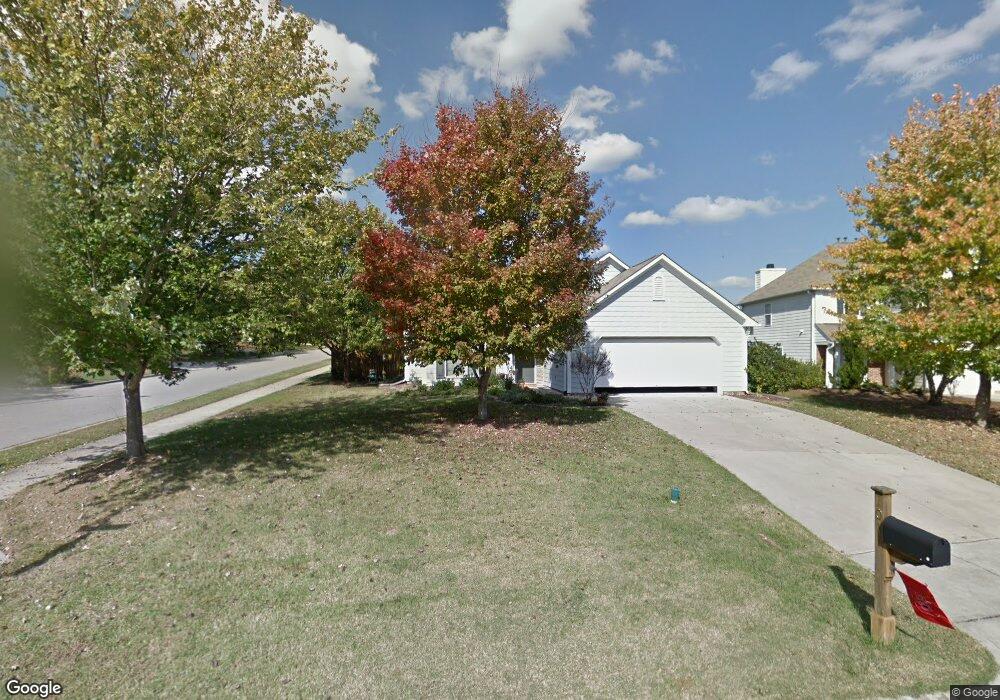
101 Fallon Ct Apex, NC 27502
West Apex NeighborhoodEstimated Value: $417,000 - $463,000
3
Beds
2
Baths
1,560
Sq Ft
$283/Sq Ft
Est. Value
About This Home
This home is located at 101 Fallon Ct, Apex, NC 27502 and is currently estimated at $441,994, approximately $283 per square foot. 101 Fallon Ct is a home located in Wake County with nearby schools including Olive Chapel Elementary School, Lufkin Road Middle School, and Apex Friendship High School.
Ownership History
Date
Name
Owned For
Owner Type
Purchase Details
Closed on
Jul 29, 2010
Sold by
Vuncannon Jessica and Vuncannon Darrel
Bought by
Hartofelis Evelyn A
Current Estimated Value
Home Financials for this Owner
Home Financials are based on the most recent Mortgage that was taken out on this home.
Original Mortgage
$125,000
Outstanding Balance
$83,469
Interest Rate
4.74%
Mortgage Type
New Conventional
Estimated Equity
$358,525
Purchase Details
Closed on
Jul 30, 1999
Sold by
D R Horton Inc Torrey
Bought by
Sidgreaves Robert H and Sidgreaves Jessica I
Home Financials for this Owner
Home Financials are based on the most recent Mortgage that was taken out on this home.
Original Mortgage
$135,955
Interest Rate
7.66%
Create a Home Valuation Report for This Property
The Home Valuation Report is an in-depth analysis detailing your home's value as well as a comparison with similar homes in the area
Home Values in the Area
Average Home Value in this Area
Purchase History
| Date | Buyer | Sale Price | Title Company |
|---|---|---|---|
| Hartofelis Evelyn A | $194,000 | None Available | |
| Sidgreaves Robert H | $151,500 | -- |
Source: Public Records
Mortgage History
| Date | Status | Borrower | Loan Amount |
|---|---|---|---|
| Open | Hartofelis Evelyn A | $125,000 | |
| Previous Owner | Sidgreaves Robert H | $135,955 |
Source: Public Records
Tax History
| Year | Tax Paid | Tax Assessment Tax Assessment Total Assessment is a certain percentage of the fair market value that is determined by local assessors to be the total taxable value of land and additions on the property. | Land | Improvement |
|---|---|---|---|---|
| 2025 | $3,820 | $435,235 | $180,000 | $255,235 |
| 2024 | $3,735 | $435,235 | $180,000 | $255,235 |
Source: Public Records
Map
Nearby Homes
- 312 Brierridge Dr
- 305 Montvale Ct
- 3025 Equinox Ct
- 405 Homestead Park Dr
- 102 Checker Ct
- 3008 Yorkmont Ct
- 3138 Cathedral Comb Dr
- 3120 Cathedral Comb Dr
- 3106 Cathedral Comb Dr
- 3104 Cathedral Comb Dr
- 3110 Honeydew Dr Unit Lot 198
- 3120 Cathedral Comb Dr Unit 247
- 3118 Cathedral Comb Dr
- 3116 Dadant Dr
- 3116 Dadant Dr Unit Lot 186
- 3116 Cathedral Comb Dr
- 3102 Cathedral Comb Dr
- 3110 Honeydew Dr
- 4012 Winecott Dr
- 2997 Green Tractor Ave
- 103 Fallon Ct
- 205 Brierridge Dr
- 105 Fallon Ct
- 208 Brierridge Dr
- 301 Brierridge Dr
- 210 Brierridge Dr
- 206 Brierridge Dr
- 603 Averroe Dr
- 601 Averroe Dr
- 212 Brierridge Dr
- 605 Averroe Dr
- 104 Fallon Ct
- 303 Brierridge Dr
- 204 Brierridge Dr
- 202 Brierridge Dr
- 300 Brierridge Dr
- 809 Brickstone Dr
- 807 Brickstone Dr
- 305 Brierridge Dr
- 201 Chapel Valley Ln
Your Personal Tour Guide
Ask me questions while you tour the home.