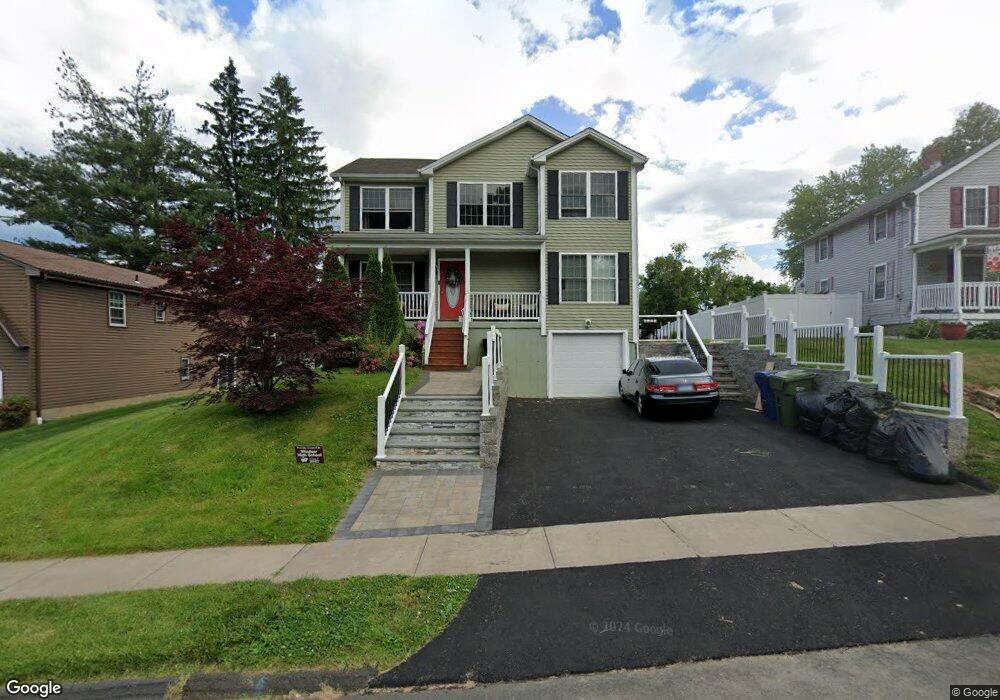
101 Faneuil St Windsor, CT 06095
Wilson NeighborhoodEstimated Value: $360,000 - $396,000
4
Beds
3
Baths
1,764
Sq Ft
$215/Sq Ft
Est. Value
About This Home
This home is located at 101 Faneuil St, Windsor, CT 06095 and is currently estimated at $379,911, approximately $215 per square foot. 101 Faneuil St is a home located in Hartford County with nearby schools including Poquonock Elementary School, Clover Street School, and Sage Park Middle School.
Ownership History
Date
Name
Owned For
Owner Type
Purchase Details
Closed on
Jul 21, 2011
Sold by
Walsh James
Bought by
Brown Monique
Current Estimated Value
Home Financials for this Owner
Home Financials are based on the most recent Mortgage that was taken out on this home.
Original Mortgage
$228,749
Interest Rate
4.49%
Mortgage Type
Purchase Money Mortgage
Purchase Details
Closed on
Aug 17, 2010
Sold by
Haines Daisha
Bought by
Walsh James
Create a Home Valuation Report for This Property
The Home Valuation Report is an in-depth analysis detailing your home's value as well as a comparison with similar homes in the area
Home Values in the Area
Average Home Value in this Area
Purchase History
| Date | Buyer | Sale Price | Title Company |
|---|---|---|---|
| Brown Monique | $234,700 | -- | |
| Walsh James | $37,500 | -- |
Source: Public Records
Mortgage History
| Date | Status | Borrower | Loan Amount |
|---|---|---|---|
| Open | Walsh James | $228,522 | |
| Closed | Walsh James | $228,749 | |
| Previous Owner | Walsh James | $135,050 |
Source: Public Records
Tax History
| Year | Tax Paid | Tax Assessment Tax Assessment Total Assessment is a certain percentage of the fair market value that is determined by local assessors to be the total taxable value of land and additions on the property. | Land | Improvement |
|---|---|---|---|---|
| 2025 | $7,003 | $222,670 | $40,880 | $181,790 |
| 2024 | $7,419 | $222,670 | $40,880 | $181,790 |
| 2023 | $5,519 | $150,780 | $28,700 | $122,080 |
| 2022 | $5,469 | $150,780 | $28,700 | $122,080 |
| 2021 | $5,469 | $150,780 | $28,700 | $122,080 |
| 2020 | $5,445 | $150,780 | $28,700 | $122,080 |
| 2019 | $5,335 | $150,780 | $28,700 | $122,080 |
| 2018 | $5,309 | $147,630 | $28,700 | $118,930 |
| 2017 | $4,791 | $147,630 | $28,700 | $118,930 |
| 2016 | $4,653 | $147,630 | $28,700 | $118,930 |
| 2015 | $4,565 | $147,630 | $28,700 | $118,930 |
| 2014 | $4,498 | $147,630 | $28,700 | $118,930 |
Source: Public Records
Map
Nearby Homes
- 28 Skitchewaug St
- 19 Songonosk St
- 36 Lepage Rd
- 20 Seymour St
- 71 Seymour St
- 158 Colton St
- 110 Woodland St
- 58 Amanda Cir
- 5 Ashley Rd
- 961 Windsor Ave
- 75 Elizabeth Ave
- 97 E Burnham St
- 98 E Burnham St
- 283 Martin St
- 2 Sandra Dr
- 26-28 Baltic St
- 94 Ludlow Rd
- 165 Martin St Unit 167
- 139 Clark St Unit B
- 11-13 Pershing St
Your Personal Tour Guide
Ask me questions while you tour the home.