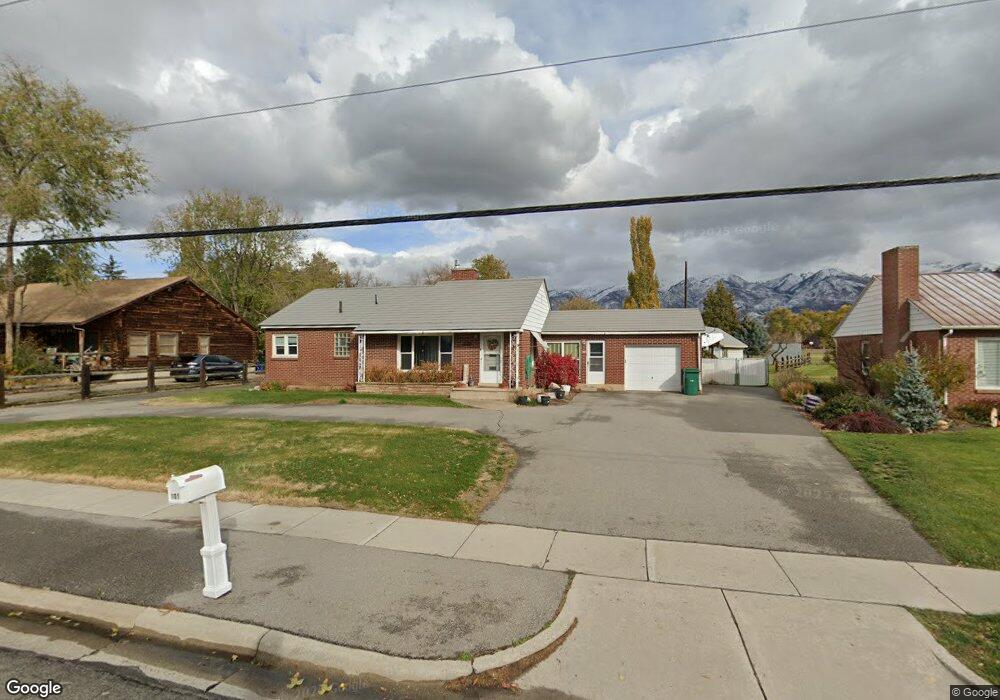
101 Flint St Layton, UT 84041
Estimated Value: $432,000 - $529,535
3
Beds
2
Baths
1,508
Sq Ft
$322/Sq Ft
Est. Value
About This Home
This home is located at 101 Flint St, Layton, UT 84041 and is currently estimated at $485,884, approximately $322 per square foot. 101 Flint St is a home located in Davis County with nearby schools including Layton Elementary School, Fairfield Junior High School, and Layton High School.
Ownership History
Date
Name
Owned For
Owner Type
Purchase Details
Closed on
Nov 29, 2017
Sold by
Earl Christine and Earl Bernice S
Bought by
Earl Curtis S and Earl Tiffany L
Current Estimated Value
Home Financials for this Owner
Home Financials are based on the most recent Mortgage that was taken out on this home.
Original Mortgage
$226,000
Outstanding Balance
$189,527
Interest Rate
3.88%
Mortgage Type
New Conventional
Estimated Equity
$296,357
Purchase Details
Closed on
May 9, 2001
Sold by
Cox Kevin T and Cox Cynthia W
Bought by
Earl Christine and Earl Bernice S
Purchase Details
Closed on
Oct 24, 1997
Sold by
Smith Howard B
Bought by
Cox Kevin T and Cox Cynthia W
Home Financials for this Owner
Home Financials are based on the most recent Mortgage that was taken out on this home.
Original Mortgage
$54,000
Interest Rate
7.49%
Purchase Details
Closed on
Dec 4, 1996
Sold by
Mcbride Patricia Rose and Mcbride Patricia R
Bought by
Smith Rozella B
Create a Home Valuation Report for This Property
The Home Valuation Report is an in-depth analysis detailing your home's value as well as a comparison with similar homes in the area
Home Values in the Area
Average Home Value in this Area
Purchase History
| Date | Buyer | Sale Price | Title Company |
|---|---|---|---|
| Earl Curtis S | -- | Founders Title | |
| Earl Christine | -- | Security Title Company | |
| Cox Kevin T | -- | Founders Title Company | |
| Smith Rozella B | -- | -- |
Source: Public Records
Mortgage History
| Date | Status | Borrower | Loan Amount |
|---|---|---|---|
| Open | Earl Curtis S | $226,000 | |
| Previous Owner | Cox Kevin T | $54,000 |
Source: Public Records
Tax History
| Year | Tax Paid | Tax Assessment Tax Assessment Total Assessment is a certain percentage of the fair market value that is determined by local assessors to be the total taxable value of land and additions on the property. | Land | Improvement |
|---|---|---|---|---|
| 2025 | $2,510 | $263,450 | $164,132 | $99,318 |
| 2024 | $2,455 | $259,601 | $183,761 | $75,840 |
| 2023 | $2,168 | $404,000 | $219,605 | $184,395 |
| 2022 | $2,337 | $236,500 | $112,038 | $124,462 |
| 2021 | $2,186 | $330,000 | $167,917 | $162,083 |
| 2020 | $1,975 | $286,000 | $147,665 | $138,335 |
| 2019 | $1,925 | $273,000 | $135,854 | $137,146 |
| 2018 | $1,707 | $243,000 | $120,814 | $122,186 |
| 2016 | $1,522 | $111,815 | $55,744 | $56,071 |
| 2015 | $1,507 | $105,105 | $55,744 | $49,361 |
| 2014 | $1,651 | $117,741 | $55,744 | $61,997 |
| 2013 | -- | $83,702 | $44,718 | $38,984 |
Source: Public Records
Map
Nearby Homes
Your Personal Tour Guide
Ask me questions while you tour the home.