101 Forest St Worcester, MA 01609
Forest Grove NeighborhoodEstimated Value: $667,784 - $748,000
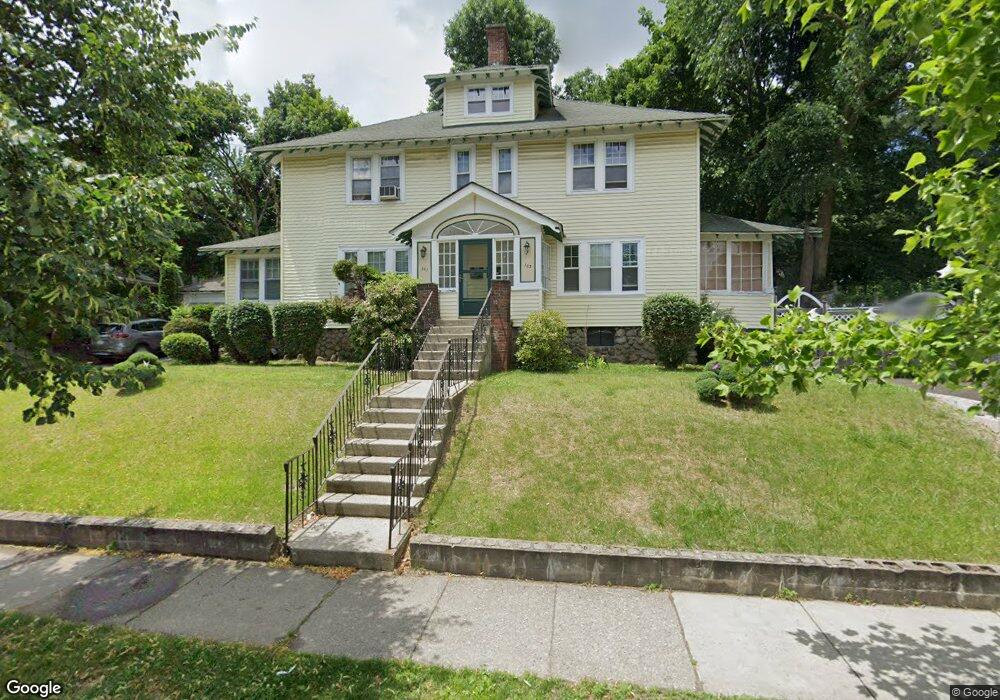
About This Home
This home is located at 101 Forest St, Worcester, MA 01609 and is currently estimated at $716,446, approximately $455 per square foot. 101 Forest St is a home located in Worcester County with nearby schools including Nelson Place Elementary School, Jacob Hiatt Magnet School, and Chandler Magnet.
Ownership History
We collect this data history from publicly available records. To have your information removed, we recommend requesting removal directly through your county’s website.
Purchase Details
Purchase Details
Home Financials for this Owner
Home Financials are based on the most recent Mortgage that was taken out on this home.Home Values in the Area
Average Home Value in this Area
Purchase History
We collect this data history from publicly available records. To have your information removed, we recommend requesting removal directly through your county’s website.
| Date | Buyer | Sale Price | Title Company |
|---|---|---|---|
| -- | None Available | ||
| $151,000 | -- |
Mortgage History
We collect this data history from publicly available records. To have your information removed, we recommend requesting removal directly through your county’s website.
| Date | Status | Borrower | Loan Amount |
|---|---|---|---|
| Previous Owner | $248,453 | ||
| Previous Owner | $197,000 | ||
| Previous Owner | $145,655 |
Tax History
We collect this data history from publicly available records. To have your information removed, we recommend requesting removal directly through your county’s website.
| Year | Tax Paid | Tax Assessment Tax Assessment Total Assessment is a certain percentage of the fair market value that is determined by local assessors to be the total taxable value of land and additions on the property. | Land | Improvement |
|---|---|---|---|---|
| 2025 | $8,034 | $609,100 | $123,500 | $485,600 |
| 2024 | $7,855 | $571,300 | $123,500 | $447,800 |
| 2023 | $7,137 | $497,700 | $106,300 | $391,400 |
| 2022 | $7,248 | $476,500 | $85,100 | $391,400 |
| 2021 | $6,393 | $392,700 | $68,100 | $324,600 |
| 2020 | $5,678 | $334,000 | $67,900 | $266,100 |
| 2019 | $5,762 | $320,100 | $65,500 | $254,600 |
| 2018 | $5,923 | $313,200 | $65,500 | $247,700 |
| 2017 | $5,951 | $309,600 | $65,500 | $244,100 |
| 2016 | $5,925 | $287,500 | $53,400 | $234,100 |
| 2015 | $5,770 | $287,500 | $53,400 | $234,100 |
| 2014 | $5,428 | $277,800 | $53,400 | $224,400 |
Map
- 522 Grove St
- 32 Indian Lake Pkwy
- 577 Grove St
- 47 Indian Lake Pkwy
- 7 Chadwick St
- 5 Algonquin Rd
- 20 Westwood Dr
- 46 Hastings Ave
- 42 Hastings Ave
- 39 Boyd St
- 1 Surrey Ln
- 5 Loring St
- 61 Nelson Place
- 335 Salisbury St
- 22 Whitman Rd
- 35 Boardman St
- 437 Salisbury St
- 8 Montvale Rd
- 10 Hemans St Unit 21
- 32 Terrace Dr
Ask me questions while you tour the home.