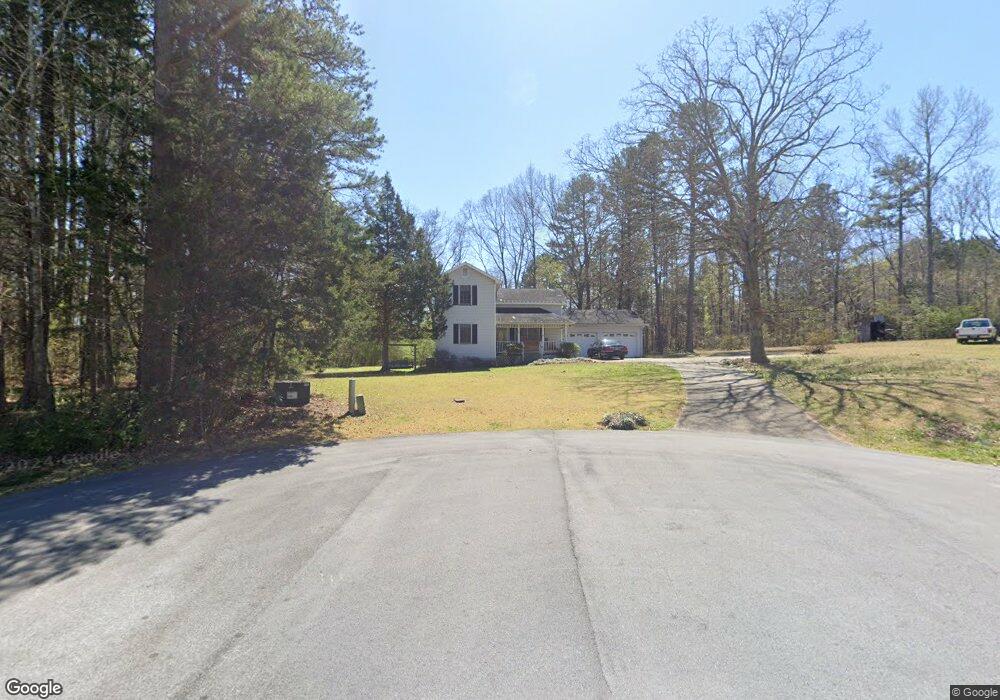
101 Forrest Ln Cedartown, GA 30125
Estimated Value: $225,000 - $268,000
3
Beds
2
Baths
1,692
Sq Ft
$146/Sq Ft
Est. Value
About This Home
This home is located at 101 Forrest Ln, Cedartown, GA 30125 and is currently estimated at $247,825, approximately $146 per square foot. 101 Forrest Ln is a home located in Polk County with nearby schools including Cedar Christian School and Vineyard Harvester Christian Academy.
Ownership History
Date
Name
Owned For
Owner Type
Purchase Details
Closed on
Aug 30, 2024
Sold by
Brazier Tony L
Bought by
Wofford Nendra
Current Estimated Value
Home Financials for this Owner
Home Financials are based on the most recent Mortgage that was taken out on this home.
Original Mortgage
$160,606
Outstanding Balance
$158,888
Interest Rate
6.73%
Mortgage Type
New Conventional
Estimated Equity
$88,937
Purchase Details
Closed on
Feb 20, 2009
Sold by
Brazier Stephanie L
Bought by
Brazier Tony L
Purchase Details
Closed on
Jan 29, 1999
Sold by
Wiggins Harold and Wiggins Rebecca
Bought by
Brazier Tony L and Brazier Stephanie L
Purchase Details
Closed on
Sep 10, 1987
Sold by
Mcelwee Croker and Mcelwee Con
Bought by
Wiggins Harold
Purchase Details
Closed on
Jun 9, 1978
Sold by
Croker James B
Bought by
Mcelwee Croker and Mcelwee Con
Purchase Details
Closed on
Oct 23, 1973
Bought by
Croker James B
Create a Home Valuation Report for This Property
The Home Valuation Report is an in-depth analysis detailing your home's value as well as a comparison with similar homes in the area
Home Values in the Area
Average Home Value in this Area
Purchase History
| Date | Buyer | Sale Price | Title Company |
|---|---|---|---|
| Wofford Nendra | $159,000 | -- | |
| Brazier Tony L | -- | -- | |
| Brazier Tony L | $72,300 | -- | |
| Wiggins Harold | $4,500 | -- | |
| Mcelwee Croker | -- | -- | |
| Croker James B | -- | -- |
Source: Public Records
Mortgage History
| Date | Status | Borrower | Loan Amount |
|---|---|---|---|
| Open | Wofford Nendra | $160,606 |
Source: Public Records
Tax History Compared to Growth
Tax History
| Year | Tax Paid | Tax Assessment Tax Assessment Total Assessment is a certain percentage of the fair market value that is determined by local assessors to be the total taxable value of land and additions on the property. | Land | Improvement |
|---|---|---|---|---|
| 2024 | $1,822 | $87,165 | $12,000 | $75,165 |
| 2023 | $1,332 | $56,106 | $8,000 | $48,106 |
| 2022 | $1,088 | $45,827 | $4,480 | $41,347 |
| 2021 | $1,102 | $45,827 | $4,480 | $41,347 |
| 2020 | $1,104 | $45,827 | $4,480 | $41,347 |
| 2019 | $1,166 | $43,431 | $4,000 | $39,431 |
| 2018 | $1,127 | $40,918 | $3,366 | $37,552 |
| 2017 | $1,113 | $40,918 | $3,366 | $37,552 |
| 2016 | $1,113 | $40,918 | $3,366 | $37,552 |
| 2015 | $1,124 | $41,177 | $3,366 | $37,811 |
| 2014 | $1,169 | $42,519 | $2,646 | $39,874 |
Source: Public Records
Map
Nearby Homes
- 209 Ridgewood Rd
- 202 Ridgewood Rd
- 10 Woodglen Dr
- 0 Coaling Rd Unit 9221-D 10352096
- 0 Coaling Rd Unit 9221-C 10352086
- 0 Coaling Rd Unit 9221 10352063
- 0 Coaling Rd Unit 9221-B 10352079
- 728 Hutto Rd
- 618 Valley Rd
- 1101 East Ave
- 645 Valley Rd
- 00 Juliette St
- 662 Hillside Dr
- 660 Valley Rd
- 109 Perry St
- 256 Cuzzort Rd
- 205 Pinecrest Rd
- 537 Fletcher St
- 427 Park St
- 77 Ben Dr W
- 103 Forrest Ln
- 107 Forrest Ln
- 104 Forrest Ln
- 402 Ridgewood Rd
- 106 Forrest Ln
- 193 Oak Knoll Ln
- 400 Ridgewood Rd
- 108 Forrest Ln
- 403 Ridgewood Rd
- 201 Oak Knoll Ln Unit 46-47
- 201 Oak Knoll Ln
- 110 Forrest Ln
- 357 Woodall Rd
- 401 Ridgewood Rd
- 201 Oak Knoll Rd Unit 46-47
- 0 Forrest Ln Unit 8007378
- 302 Ridgewood Rd
- 361 Woodall Rd
- 387 Woodall Rd
- 112 Pine Ridge Ln