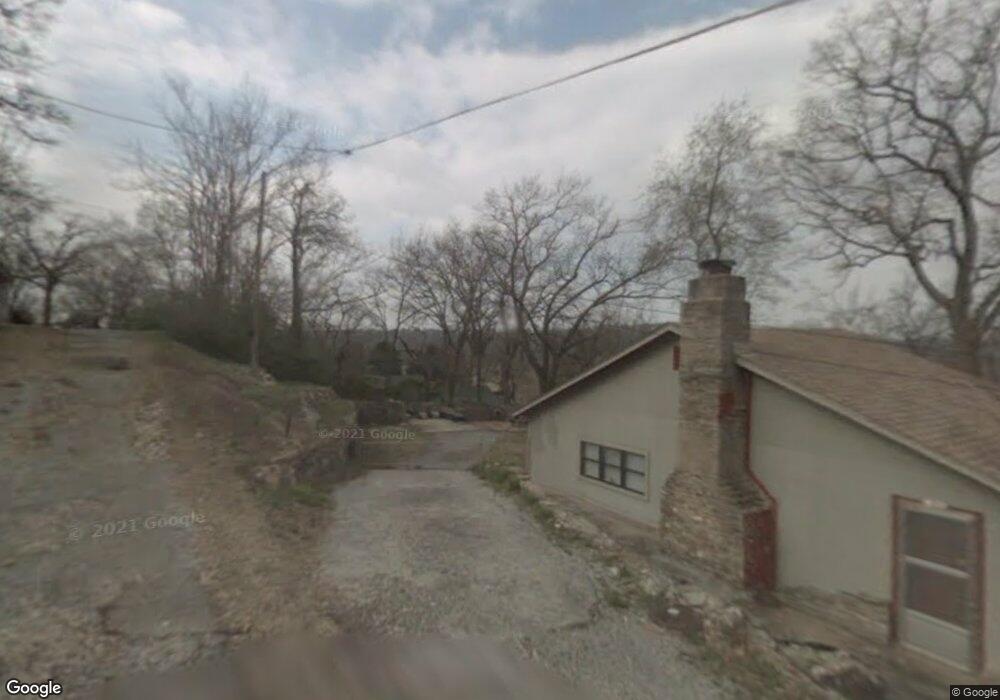
101 Frances St Spavinaw, OK 74366
Estimated Value: $132,000 - $164,000
3
Beds
2
Baths
1,568
Sq Ft
$93/Sq Ft
Est. Value
About This Home
This home is located at 101 Frances St, Spavinaw, OK 74366 and is currently estimated at $146,333, approximately $93 per square foot. 101 Frances St is a home with nearby schools including Jay Elementary School, Jay Upper Elementary School, and Jay Middle School.
Ownership History
Date
Name
Owned For
Owner Type
Purchase Details
Closed on
Oct 14, 2022
Sold by
Michelle Kernel Revocable Trust
Bought by
Regan Daniel
Current Estimated Value
Home Financials for this Owner
Home Financials are based on the most recent Mortgage that was taken out on this home.
Original Mortgage
$92,000
Outstanding Balance
$88,410
Interest Rate
6.02%
Mortgage Type
New Conventional
Estimated Equity
$57,923
Purchase Details
Closed on
Mar 15, 2022
Sold by
Shoots Sammy L and Shoots Michelle L
Bought by
Kernel Michael L and Kernel Nathanel
Purchase Details
Closed on
Aug 1, 2011
Sold by
Kernel Michelle
Bought by
Kernel Michelle and The Michelle L Kernel Revocable Trust
Purchase Details
Closed on
Aug 9, 2006
Sold by
American General Finance Inc
Bought by
Kernel Michelle
Purchase Details
Closed on
Mar 8, 2004
Sold by
Brown John and Brown Cynthia
Bought by
American General Finance
Create a Home Valuation Report for This Property
The Home Valuation Report is an in-depth analysis detailing your home's value as well as a comparison with similar homes in the area
Purchase History
| Date | Buyer | Sale Price | Title Company |
|---|---|---|---|
| Regan Daniel | $115,000 | Fidelity National Title | |
| Kernel Michael L | $20,000 | None Listed On Document | |
| Kernel Michelle | -- | None Available | |
| Kernel Michelle | $20,000 | Mayes County Abstract Compan | |
| American General Finance | -- | -- |
Source: Public Records
Mortgage History
| Date | Status | Borrower | Loan Amount |
|---|---|---|---|
| Open | Regan Daniel | $92,000 |
Source: Public Records
Tax History
| Year | Tax Paid | Tax Assessment Tax Assessment Total Assessment is a certain percentage of the fair market value that is determined by local assessors to be the total taxable value of land and additions on the property. | Land | Improvement |
|---|---|---|---|---|
| 2025 | $1,203 | $14,271 | $2,265 | $12,006 |
| 2024 | $1,160 | $13,592 | $1,746 | $11,846 |
| 2023 | $1,160 | $12,945 | $1,399 | $11,546 |
| 2022 | $347 | $5,050 | $466 | $4,584 |
| 2021 | $303 | $5,043 | $466 | $4,577 |
| 2020 | $305 | $4,935 | $466 | $4,469 |
| 2019 | $295 | $4,792 | $466 | $4,326 |
| 2018 | $287 | $4,652 | $466 | $4,186 |
| 2017 | $279 | $4,517 | $466 | $4,051 |
| 2016 | $266 | $4,385 | $1,207 | $3,178 |
| 2015 | $232 | $4,385 | $1,207 | $3,178 |
| 2014 | $232 | $4,385 | $1,207 | $3,178 |
Source: Public Records
Map
Nearby Homes
- 215 & 217 N Cherokee St
- 213 Cherokee St Unit Block 2, Lots 14, 15
- 2889 NE 4448 Dr
- Unassigned First Street & Ross Ave Unit Block 8 - Lots 1-8
- Unassigned First St Unit Block 5 - Lots 1-4 &
- 105 Oak St
- 0 E 427 Rd Unit 2531895
- 600 S Main St
- 210 N Baldwin Ave
- 341 E 437
- 380 E 437
- 400 W Tulsa
- 619 E 437
- 7703 N 447 Rd
- 0 E 420 Rd Unit 2609662
- 3537 NE 4448 Dr
- 8354 Highway 82 N
- 7236 N Highway 82
- 19 NE 4471 Rd
- 00 Moccasin Ln
Your Personal Tour Guide
Ask me questions while you tour the home.