Estimated Value: $414,000 - $464,000
4
Beds
2
Baths
2,002
Sq Ft
$215/Sq Ft
Est. Value
About This Home
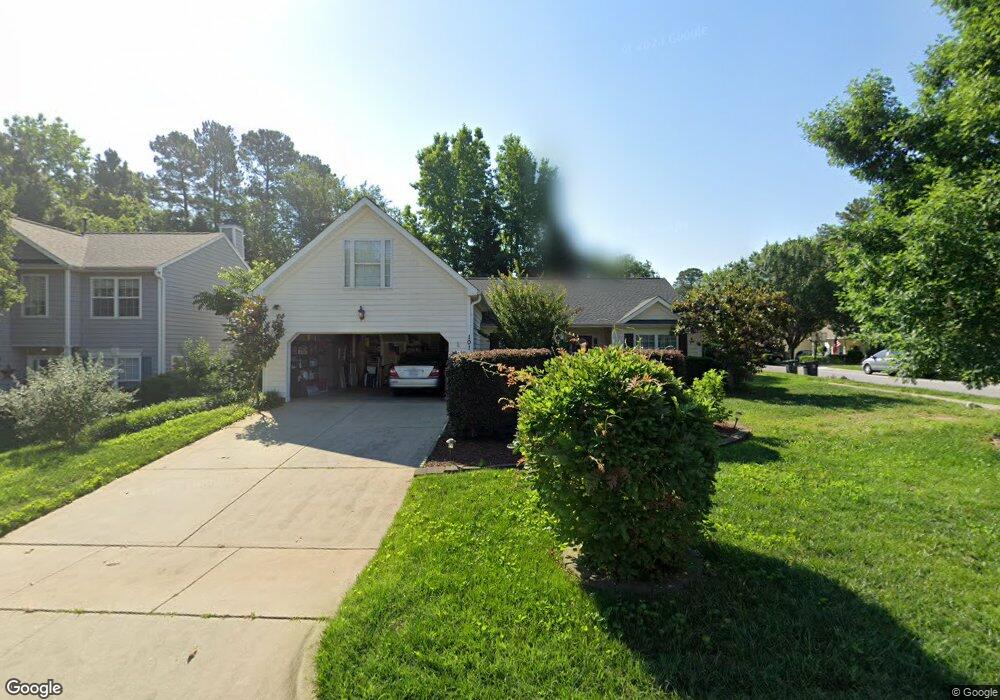
This home is located at 101 Gables Gate Ct, Apex, NC 27539 and is currently estimated at $429,691, approximately $214 per square foot. 101 Gables Gate Ct is a home located in Wake County with nearby schools including Lufkin Road Middle School, Apex Friendship High School, and Pine Springs Prep Academy.
Ownership History
Date
Name
Owned For
Owner Type
Purchase Details
Closed on
Oct 22, 2012
Bought by
Guha Rajesh and Guha Vishakha
Current Estimated Value
Purchase Details
Closed on
Aug 27, 2007
Sold by
Donaldson Michael H and Donaldson Dorothy L
Bought by
Provost Nancy and Shockley Debra
Home Financials for this Owner
Home Financials are based on the most recent Mortgage that was taken out on this home.
Original Mortgage
$55,000
Interest Rate
6.35%
Mortgage Type
New Conventional
Purchase Details
Closed on
Jul 16, 1999
Sold by
D R Horton Inc Torrey
Bought by
Donaldson Michael H and Donaldson Dorothy L
Home Financials for this Owner
Home Financials are based on the most recent Mortgage that was taken out on this home.
Original Mortgage
$137,950
Interest Rate
7.51%
Create a Home Valuation Report for This Property
The Home Valuation Report is an in-depth analysis detailing your home's value as well as a comparison with similar homes in the area
Home Values in the Area
Average Home Value in this Area
Purchase History
| Date | Buyer | Sale Price | Title Company |
|---|---|---|---|
| Guha Rajesh | $205,000 | -- | |
| Provost Nancy | $197,500 | None Available | |
| Donaldson Michael H | $143,500 | -- |
Source: Public Records
Mortgage History
| Date | Status | Borrower | Loan Amount |
|---|---|---|---|
| Previous Owner | Provost Nancy | $55,000 | |
| Previous Owner | Donaldson Michael H | $137,950 |
Source: Public Records
Tax History Compared to Growth
Tax History
| Year | Tax Paid | Tax Assessment Tax Assessment Total Assessment is a certain percentage of the fair market value that is determined by local assessors to be the total taxable value of land and additions on the property. | Land | Improvement |
|---|---|---|---|---|
| 2025 | $3,389 | $385,844 | $160,000 | $225,844 |
| 2024 | $3,313 | $385,844 | $160,000 | $225,844 |
| 2023 | $2,930 | $265,227 | $70,000 | $195,227 |
| 2022 | $2,751 | $265,227 | $70,000 | $195,227 |
| 2021 | $2,646 | $265,227 | $70,000 | $195,227 |
| 2020 | $2,619 | $265,227 | $70,000 | $195,227 |
| 2019 | $2,432 | $212,340 | $62,000 | $150,340 |
| 2018 | $2,291 | $212,340 | $62,000 | $150,340 |
| 2017 | $2,133 | $212,340 | $62,000 | $150,340 |
| 2016 | $2,102 | $212,340 | $62,000 | $150,340 |
| 2015 | $1,950 | $192,094 | $42,000 | $150,094 |
| 2014 | -- | $192,094 | $42,000 | $150,094 |
Source: Public Records
Map
Nearby Homes
- 102 Spring Dove Ln
- 108 Bella Place
- 300 Firefly Rd
- 148 Danesway Dr
- 314 Cabana Dr
- 413 Hyannis Dr
- 317 Commons Dr
- 5712 Mosley Ave
- 201 Holmby Ct
- 5828 Old Smithfield Rd
- 105 Arbor Wynds Ct
- 1539 N Main St
- 3906 Mc Clain St
- 3332 Colby Chase Dr Unit Lot 3
- 3340 Colby Chase Dr Unit Lot 2
- 212 Mystic Pine Place
- 680 Wickham Ridge Rd
- 825 Wickham Ridge Rd
- 5417 Bobbitt Rd
- 109 Willow View Ln
- 103 Gables Gate Ct
- 205 Ridge Lake Dr
- 105 Gables Gate Ct
- 208 Ridge Lake Dr
- 301 Ridge Lake Dr
- 206 Ridge Lake Dr
- 203 Ridge Lake Dr
- 210 Ridge Lake Dr
- 204 Ridge Lake Dr
- 106 Gables Gate Ct
- 300 Ridge Lake Dr
- 205 Stonecreek Dr
- 107 Gables Gate Ct
- 303 Ridge Lake Dr
- 202 Ridge Lake Dr
- 201 Ridge Lake Dr
- 301 Stonecreek Dr
- 302 Ridge Lake Dr
- 110 Gables Gate Ct
- 200 Ridge Lake Dr