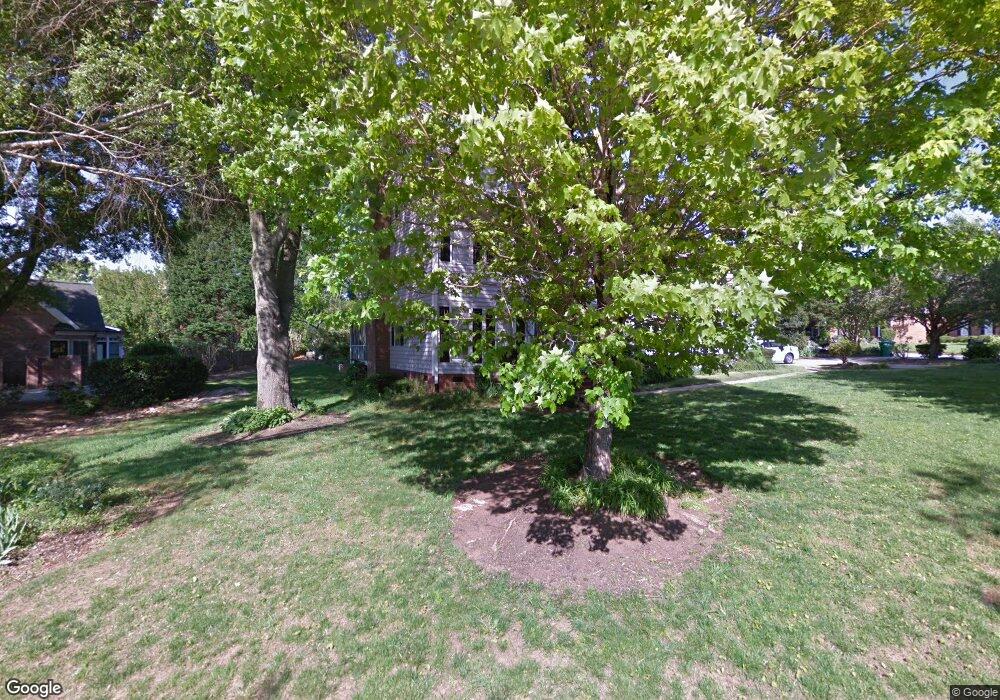
101 Gilderview Dr Simpsonville, SC 29681
Estimated Value: $639,961 - $738,000
5
Beds
4
Baths
3,504
Sq Ft
$194/Sq Ft
Est. Value
About This Home
This home is located at 101 Gilderview Dr, Simpsonville, SC 29681 and is currently estimated at $678,490, approximately $193 per square foot. 101 Gilderview Dr is a home located in Greenville County with nearby schools including Monarch Elementary, Mauldin Middle School, and Mauldin High School.
Ownership History
Date
Name
Owned For
Owner Type
Purchase Details
Closed on
Dec 16, 2009
Sold by
Miers Christopher J and Miers Georgina R
Bought by
Miers Christopher J and Miers Georgina R
Current Estimated Value
Home Financials for this Owner
Home Financials are based on the most recent Mortgage that was taken out on this home.
Original Mortgage
$224,000
Outstanding Balance
$146,928
Interest Rate
5.01%
Mortgage Type
New Conventional
Estimated Equity
$531,562
Purchase Details
Closed on
Oct 31, 2008
Sold by
Pierce Kirk G and Pierce Shamarie
Bought by
Miers Christopher J and Meirs Georgina R
Purchase Details
Closed on
Aug 9, 2004
Sold by
Weichert Relocation Resources
Bought by
Pierce Kirk G
Purchase Details
Closed on
Aug 8, 2004
Sold by
Weichert Relocation Resources
Bought by
Pierce Kirk G
Purchase Details
Closed on
Sep 5, 2003
Sold by
Moore Ronald W
Bought by
Moore Ronald W
Purchase Details
Closed on
Sep 2, 2003
Sold by
Moore Ronald W
Bought by
Moore Ronald W
Create a Home Valuation Report for This Property
The Home Valuation Report is an in-depth analysis detailing your home's value as well as a comparison with similar homes in the area
Home Values in the Area
Average Home Value in this Area
Purchase History
| Date | Buyer | Sale Price | Title Company |
|---|---|---|---|
| Miers Christopher J | -- | -- | |
| Miers Christopher J | $280,000 | -- | |
| Pierce Kirk G | $302,000 | -- | |
| Pierce Kirk G | $302,000 | -- | |
| Moore Ronald W | -- | -- | |
| Moore Ronald W | $284,000 | -- |
Source: Public Records
Mortgage History
| Date | Status | Borrower | Loan Amount |
|---|---|---|---|
| Open | Miers Christopher J | $224,000 |
Source: Public Records
Tax History Compared to Growth
Tax History
| Year | Tax Paid | Tax Assessment Tax Assessment Total Assessment is a certain percentage of the fair market value that is determined by local assessors to be the total taxable value of land and additions on the property. | Land | Improvement |
|---|---|---|---|---|
| 2024 | $2,319 | $15,320 | $2,640 | $12,680 |
| 2023 | $2,319 | $15,320 | $2,640 | $12,680 |
| 2022 | $2,238 | $15,320 | $2,640 | $12,680 |
| 2021 | $2,203 | $15,320 | $2,640 | $12,680 |
| 2020 | $2,039 | $13,330 | $2,300 | $11,030 |
| 2019 | $2,007 | $13,330 | $2,300 | $11,030 |
| 2018 | $2,116 | $13,330 | $2,300 | $11,030 |
| 2017 | $2,116 | $13,330 | $2,300 | $11,030 |
| 2016 | $2,034 | $333,220 | $57,500 | $275,720 |
| 2015 | $2,025 | $333,220 | $57,500 | $275,720 |
| 2014 | $1,764 | $289,760 | $50,000 | $239,760 |
Source: Public Records
Map
Nearby Homes
- 1 Gilder Trace
- 341 Parkside Dr
- 805 Carriage Hill Rd
- 3 Chadbourne Ln
- 206 Waverly Hall Ln
- 205 Waverly Hall Ln
- 6 Mendenhall Ct
- 406 Latrobe Dr
- 303 Latrobe Dr
- 30 Pine Island Dr
- 104 Gilden Ln
- 12 Moss Wood Cir
- 122 Fudora Cir
- 101 Farm Mill Cir
- 3210 Bethel Rd Unit 44
- 2 Cricken Tree Dr
- 75 Fudora Cir Unit 75
- 108 Mineral Ct
- 206 Squires Creek Rd
- 409 Heather Falls Ln
- 103 Gilderview Dr
- 23 Gilderview Dr
- 100 Gilderview Dr
- 208 River Walk Dr
- 105 Gilderview Dr
- 22 Gilderview Dr
- 108 River Walk Dr
- 104 Gilderview Dr
- 18 Gilderview Dr
- 210 River Walk Dr
- 19 Gilderview Dr
- 107 Gilderview Dr
- 9 Gilder Point Ct
- 104 River Walk Dr
- 7 Gilder Point Ct
- 106 Gilderview Dr
- 203 River Walk Dr
- 205 River Walk Dr
- 11 Gilder Point Ct
- 115 River Walk Dr