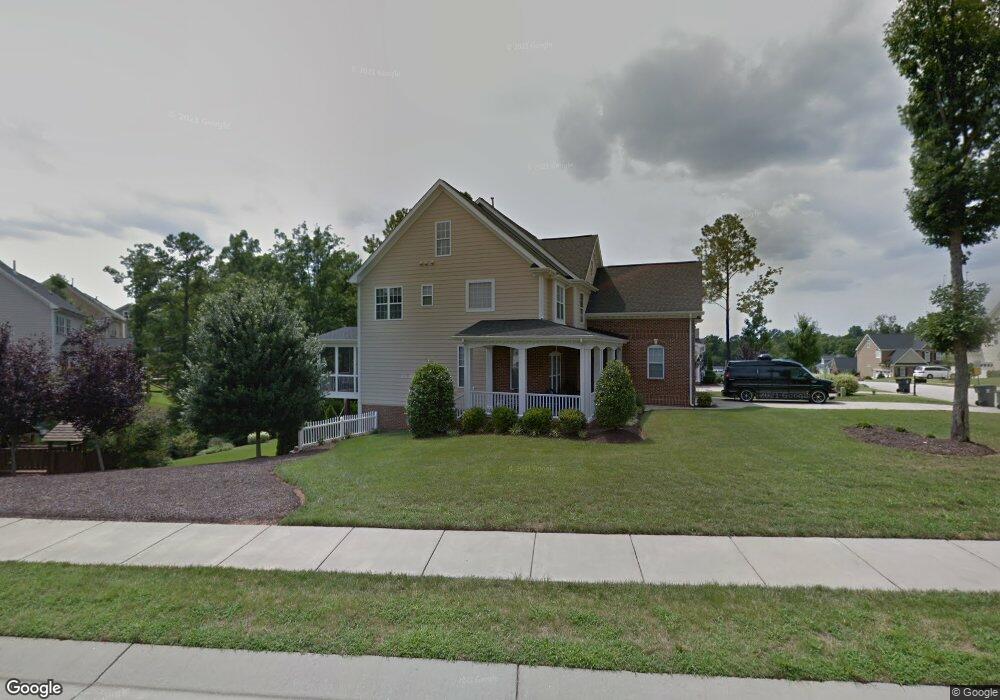
101 Gillyweed Ct Holly Springs, NC 27540
Estimated Value: $872,000 - $928,000
6
Beds
5
Baths
4,857
Sq Ft
$186/Sq Ft
Est. Value
About This Home
This home is located at 101 Gillyweed Ct, Holly Springs, NC 27540 and is currently estimated at $904,305, approximately $186 per square foot. 101 Gillyweed Ct is a home located in Wake County with nearby schools including Holly Grove Elementary School, Holly Grove Middle School, and Holly Springs High School.
Ownership History
Date
Name
Owned For
Owner Type
Purchase Details
Closed on
Jun 7, 2016
Sold by
Jose Michael San and Jose Ashley San
Bought by
Bonacum Bryan A and Bonacum Leigh K
Current Estimated Value
Home Financials for this Owner
Home Financials are based on the most recent Mortgage that was taken out on this home.
Original Mortgage
$392,800
Outstanding Balance
$312,829
Interest Rate
3.59%
Mortgage Type
New Conventional
Estimated Equity
$591,476
Purchase Details
Closed on
Dec 7, 2006
Sold by
Royal Oaks Building Group Llc
Bought by
San Jose Michael and San Jose Ashley
Home Financials for this Owner
Home Financials are based on the most recent Mortgage that was taken out on this home.
Original Mortgage
$365,167
Interest Rate
5.37%
Mortgage Type
New Conventional
Create a Home Valuation Report for This Property
The Home Valuation Report is an in-depth analysis detailing your home's value as well as a comparison with similar homes in the area
Home Values in the Area
Average Home Value in this Area
Purchase History
| Date | Buyer | Sale Price | Title Company |
|---|---|---|---|
| Bonacum Bryan A | $491,000 | None Available | |
| San Jose Michael | $456,500 | None Available |
Source: Public Records
Mortgage History
| Date | Status | Borrower | Loan Amount |
|---|---|---|---|
| Open | Bonacum Bryan A | $392,800 | |
| Closed | Bonacum Bryan A | $49,000 | |
| Previous Owner | San Jose Michael | $365,167 | |
| Previous Owner | San Jose Michael | $68,469 |
Source: Public Records
Tax History Compared to Growth
Tax History
| Year | Tax Paid | Tax Assessment Tax Assessment Total Assessment is a certain percentage of the fair market value that is determined by local assessors to be the total taxable value of land and additions on the property. | Land | Improvement |
|---|---|---|---|---|
| 2025 | $6,817 | $789,841 | $135,000 | $654,841 |
| 2024 | $6,789 | $789,841 | $135,000 | $654,841 |
| 2023 | $5,135 | $474,182 | $65,000 | $409,182 |
| 2022 | $4,957 | $474,182 | $65,000 | $409,182 |
| 2021 | $4,864 | $474,182 | $65,000 | $409,182 |
| 2020 | $4,864 | $474,182 | $65,000 | $409,182 |
| 2019 | $5,217 | $431,964 | $65,000 | $366,964 |
| 2018 | $4,715 | $431,964 | $65,000 | $366,964 |
| 2017 | $4,545 | $431,964 | $65,000 | $366,964 |
| 2016 | $4,482 | $431,964 | $65,000 | $366,964 |
| 2015 | $4,626 | $438,874 | $55,000 | $383,874 |
| 2014 | $4,466 | $438,874 | $55,000 | $383,874 |
Source: Public Records
Map
Nearby Homes
- 425 Cahors Trail
- 305 Tonks Trail
- 104 Pointe Park Cir
- 108 Pointe Park Cir
- 209 Devon Fields Dr
- 161 Summit Oaks Ln
- 100 Avent Pines Ln
- 609 Ramsours Mill Dr
- 933 Hollymont Dr
- 1712 Avent Ferry Rd
- 505 Pyracantha Dr
- 233 Hickory Glen Ln
- 113 Braxman Ln
- 200 Cloud Berry Ln
- Bedford Plan at Bridgeberry
- Hamilton Plan at Bridgeberry
- Ashford Plan at Bridgeberry
- Andrews Plan at Bridgeberry
- Sheridan Plan at Bridgeberry
- Wayland Plan at Bridgeberry
- 105 Gillyweed Ct
- 100 Tonks Trail
- 200 Long Bottom Trail
- 109 Gillyweed Ct
- 109 Long Bottom Trail
- 105 Long Bottom Trail
- 104 Tonks Trail
- 113 Long Bottom Trail
- 201 Long Bottom Trail
- 100 Gillyweed Ct
- 104 Gillyweed Ct
- 113 Gillyweed Ct
- 108 Tonks Trail
- 101 Tonks Trail
- 101 Tonks Trail Unit 69
- 101 Gryffindor Ln
- 201 Gillyweed Ct
- 205 Long Bottom Trail
- 105 Tonks Trail
- 204 Long Bottom Trail