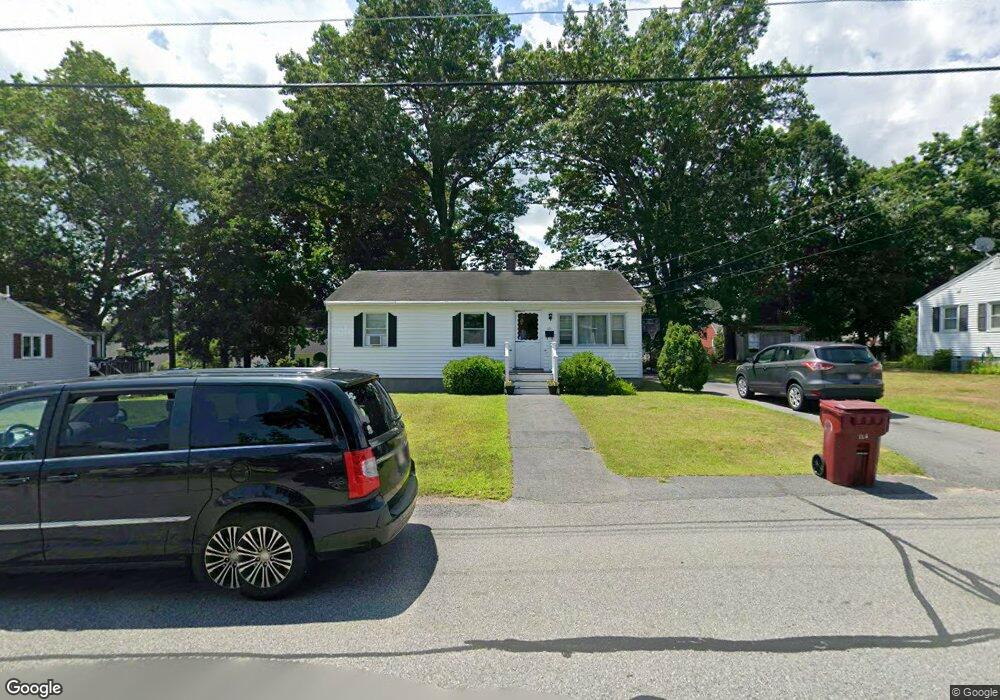
101 Glenmere St Lowell, MA 01852
Belvidere NeighborhoodEstimated Value: $483,000 - $559,000
3
Beds
1
Bath
864
Sq Ft
$597/Sq Ft
Est. Value
About This Home
This home is located at 101 Glenmere St, Lowell, MA 01852 and is currently estimated at $515,617, approximately $596 per square foot. 101 Glenmere St is a home located in Middlesex County with nearby schools including Moody Elementary School, Abraham Lincoln Elementary School, and Greenhalge Elementary School.
Ownership History
Date
Name
Owned For
Owner Type
Purchase Details
Closed on
Nov 22, 2021
Sold by
Larose James and Larose Courtney
Bought by
Larose Courtney
Current Estimated Value
Home Financials for this Owner
Home Financials are based on the most recent Mortgage that was taken out on this home.
Original Mortgage
$315,000
Outstanding Balance
$288,603
Interest Rate
2.98%
Mortgage Type
Stand Alone Refi Refinance Of Original Loan
Estimated Equity
$227,014
Purchase Details
Closed on
Nov 14, 2016
Sold by
Gail L Marchand
Bought by
Larose James M and Larose Courtney A
Home Financials for this Owner
Home Financials are based on the most recent Mortgage that was taken out on this home.
Original Mortgage
$3,945
Interest Rate
3.57%
Create a Home Valuation Report for This Property
The Home Valuation Report is an in-depth analysis detailing your home's value as well as a comparison with similar homes in the area
Home Values in the Area
Average Home Value in this Area
Purchase History
| Date | Buyer | Sale Price | Title Company |
|---|---|---|---|
| Larose Courtney | -- | None Available | |
| Larose Courtney | -- | None Available | |
| Larose James M | -- | -- |
Source: Public Records
Mortgage History
| Date | Status | Borrower | Loan Amount |
|---|---|---|---|
| Open | Larose Courtney | $315,000 | |
| Closed | Larose Courtney | $315,000 | |
| Previous Owner | Larose James M | $3,945 | |
| Previous Owner | Larose James M | -- |
Source: Public Records
Tax History
| Year | Tax Paid | Tax Assessment Tax Assessment Total Assessment is a certain percentage of the fair market value that is determined by local assessors to be the total taxable value of land and additions on the property. | Land | Improvement |
|---|---|---|---|---|
| 2025 | $5,099 | $444,200 | $237,800 | $206,400 |
| 2024 | $4,747 | $398,600 | $214,000 | $184,600 |
| 2023 | $4,472 | $360,100 | $186,100 | $174,000 |
| 2022 | $3,876 | $305,400 | $164,000 | $141,400 |
| 2021 | $3,800 | $282,300 | $142,600 | $139,700 |
| 2020 | $3,558 | $266,300 | $142,600 | $123,700 |
| 2019 | $3,502 | $249,400 | $136,300 | $113,100 |
| 2018 | $3,360 | $233,500 | $129,800 | $103,700 |
| 2017 | $3,224 | $216,100 | $115,300 | $100,800 |
| 2016 | $3,017 | $199,000 | $106,300 | $92,700 |
| 2015 | $3,043 | $196,600 | $106,300 | $90,300 |
| 2013 | $3,071 | $204,600 | $126,300 | $78,300 |
Source: Public Records
Map
Nearby Homes
- 67 Wedgemere Dr
- 251 Clark Rd
- 45 Clark Rd
- 42 Pentucket Ave
- 313 Nesmith St
- 234 Nesmith St Unit 8
- 44 Hanks St
- 200 Rogers St Unit 6
- 51 Melim Dr
- 31 Floyd Ave
- 254 Pleasant St
- 206 Burnham Rd
- 42 Christian St
- 52 Christian St
- 164 Bradley St
- 1204 Lawrence St
- 100 Merrimack Ave Unit 25
- 100 Merrimack Ave Unit 9
- 810 Lawrence St Unit C
- 80 Rogers St Unit 204
Your Personal Tour Guide
Ask me questions while you tour the home.