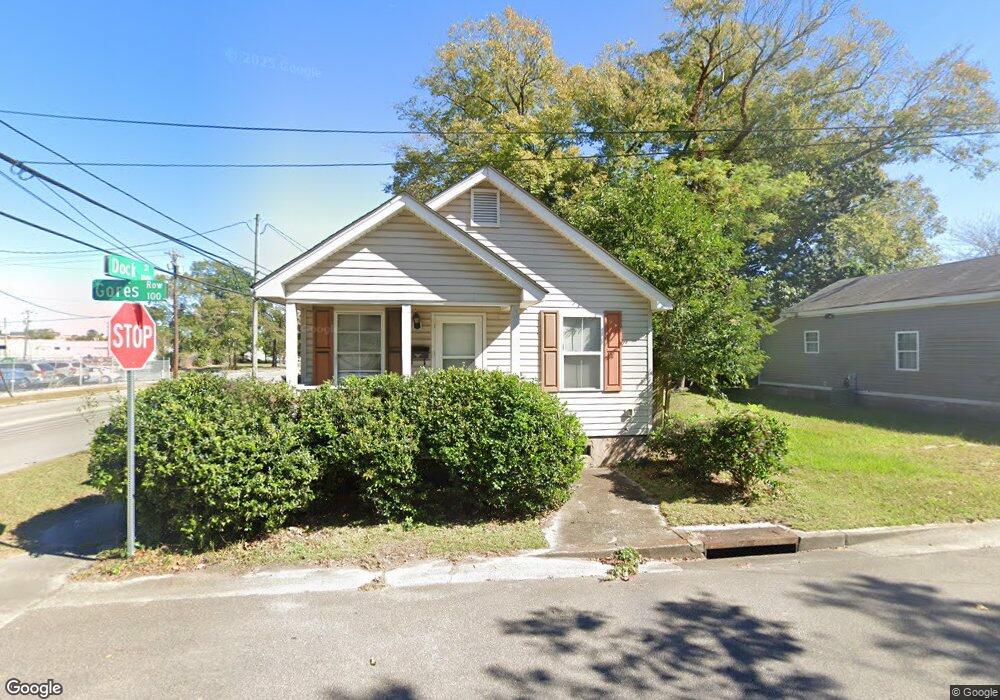
101 Gores Row Wilmington, NC 28401
The Bottom NeighborhoodEstimated Value: $258,000 - $308,000
2
Beds
2
Baths
888
Sq Ft
$306/Sq Ft
Est. Value
About This Home
This home is located at 101 Gores Row, Wilmington, NC 28401 and is currently estimated at $271,396, approximately $305 per square foot. 101 Gores Row is a home located in New Hanover County with nearby schools including Snipes Academy of Arts & Design, Williston Middle School, and New Hanover High School.
Ownership History
Date
Name
Owned For
Owner Type
Purchase Details
Closed on
Jul 26, 2006
Sold by
South Metro Properties Llc
Bought by
Mcallister Clifton Craig
Current Estimated Value
Home Financials for this Owner
Home Financials are based on the most recent Mortgage that was taken out on this home.
Original Mortgage
$23,980
Outstanding Balance
$1,746
Interest Rate
6.58%
Mortgage Type
Credit Line Revolving
Estimated Equity
$269,650
Purchase Details
Closed on
Jan 7, 2002
Sold by
R & R Company
Bought by
South Metro Properties Llc
Purchase Details
Closed on
Apr 1, 1979
Bought by
R & R Company
Create a Home Valuation Report for This Property
The Home Valuation Report is an in-depth analysis detailing your home's value as well as a comparison with similar homes in the area
Home Values in the Area
Average Home Value in this Area
Purchase History
| Date | Buyer | Sale Price | Title Company |
|---|---|---|---|
| Mcallister Clifton Craig | $120,000 | None Available | |
| South Metro Properties Llc | $12,000 | -- | |
| R & R Company | -- | -- |
Source: Public Records
Mortgage History
| Date | Status | Borrower | Loan Amount |
|---|---|---|---|
| Open | Mcallister Clifton Craig | $23,980 | |
| Open | Mcallister Clifton Craig | $95,900 |
Source: Public Records
Tax History Compared to Growth
Tax History
| Year | Tax Paid | Tax Assessment Tax Assessment Total Assessment is a certain percentage of the fair market value that is determined by local assessors to be the total taxable value of land and additions on the property. | Land | Improvement |
|---|---|---|---|---|
| 2025 | $1,494 | $253,900 | $79,400 | $174,500 |
| 2024 | $1,520 | $174,700 | $43,000 | $131,700 |
| 2023 | $1,476 | $174,700 | $43,000 | $131,700 |
| 2022 | $1,485 | $174,700 | $43,000 | $131,700 |
| 2021 | $1,495 | $174,700 | $43,000 | $131,700 |
| 2020 | $968 | $91,900 | $24,200 | $67,700 |
| 2019 | $968 | $91,900 | $24,200 | $67,700 |
| 2018 | $968 | $91,900 | $24,200 | $67,700 |
| 2017 | $968 | $91,900 | $24,200 | $67,700 |
| 2016 | $839 | $75,700 | $21,300 | $54,400 |
| 2015 | $802 | $75,700 | $21,300 | $54,400 |
| 2014 | $768 | $75,700 | $21,300 | $54,400 |
Source: Public Records
Map
Nearby Homes