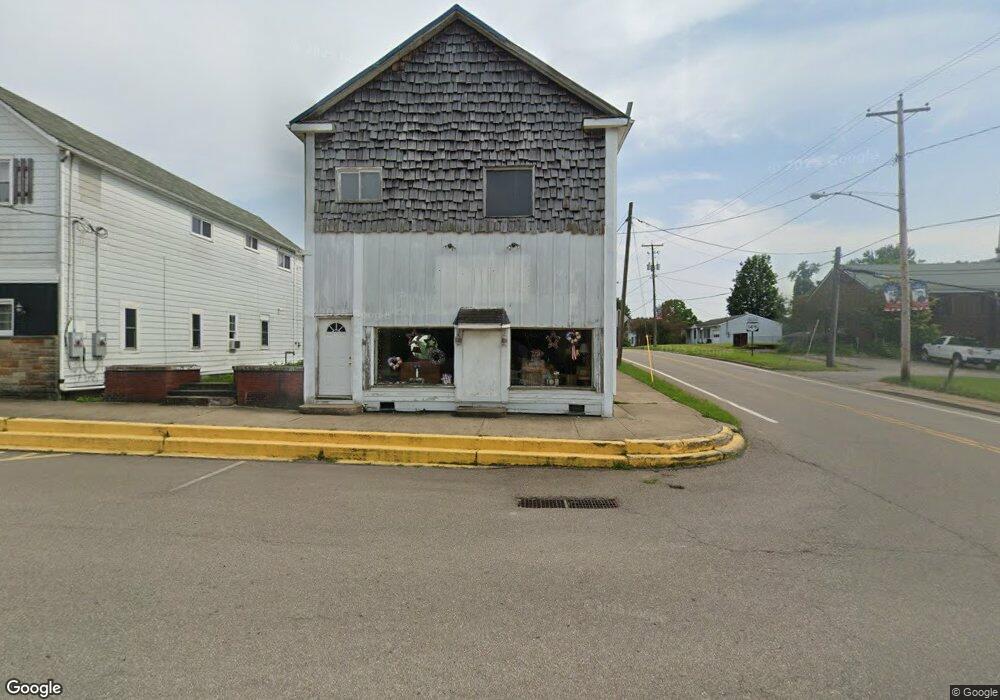
101 High St Flushing, OH 43977
Studio
--
Bath
1,560
Sq Ft
1,742
Sq Ft
About This Home
This home is located at 101 High St, Flushing, OH 43977. 101 High St is a home located in Belmont County with nearby schools including Union Local Elementary School, Union Local Middle School, and Union Local High School.
Ownership History
Date
Name
Owned For
Owner Type
Purchase Details
Closed on
Feb 25, 2010
Sold by
Twarog Randal L and Twarog Amy
Bought by
Ostrum John and Morehead Delores Williams
Purchase Details
Closed on
Sep 21, 2009
Sold by
Wesbanco Bank Inc
Bought by
Ostrum John E and Williams Morehead Dolores J
Purchase Details
Closed on
Sep 16, 2008
Sold by
Alvis William T
Bought by
Wesbanco Bank Inc
Purchase Details
Closed on
Feb 2, 2006
Sold by
Twarog Randy and Twarog Amy
Bought by
Alvis William T
Purchase Details
Closed on
May 5, 2004
Sold by
Alvis William T
Bought by
Twarog Randy and Amy Surv
Purchase Details
Closed on
Apr 17, 2000
Sold by
Mattox John Stewart and Mattox Ros
Bought by
Mattox John Stewart and Mattox Ros
Purchase Details
Closed on
Dec 10, 1997
Sold by
Gossett Helen J
Bought by
Gossett Helen J
Purchase Details
Closed on
Feb 18, 1997
Sold by
Humphrey William R
Bought by
Humphrey William R
Purchase Details
Closed on
Jan 1, 1986
Sold by
Twarog Randy and Surv Amy
Bought by
Gossett Helen J
Create a Home Valuation Report for This Property
The Home Valuation Report is an in-depth analysis detailing your home's value as well as a comparison with similar homes in the area
Purchase History
| Date | Buyer | Sale Price | Title Company |
|---|---|---|---|
| Ostrum John | $1,000 | Attorney | |
| Ostrum John E | $8,500 | Attorney | |
| Wesbanco Bank Inc | $36,000 | None Available | |
| Alvis William T | $1,000 | None Available | |
| Twarog Randy | $6,500 | -- | |
| Mattox John Stewart | -- | -- | |
| Gossett Helen J | -- | -- | |
| Humphrey William R | $10,000 | -- | |
| Gossett Helen J | -- | -- |
Source: Public Records
Tax History
| Year | Tax Paid | Tax Assessment Tax Assessment Total Assessment is a certain percentage of the fair market value that is determined by local assessors to be the total taxable value of land and additions on the property. | Land | Improvement |
|---|---|---|---|---|
| 2025 | $341 | $7,130 | $4,050 | $3,080 |
| 2023 | $166 | $3,260 | $910 | $2,350 |
| 2022 | $171 | $3,251 | $906 | $2,345 |
| 2021 | $173 | $3,251 | $906 | $2,345 |
| 2020 | $174 | $3,260 | $910 | $2,350 |
| 2019 | $176 | $3,260 | $910 | $2,350 |
| 2018 | $170 | $3,260 | $910 | $2,350 |
| 2017 | $164 | $2,960 | $880 | $2,080 |
| 2016 | $163 | $2,960 | $880 | $2,080 |
| 2015 | $166 | $2,960 | $880 | $2,080 |
| 2014 | $163 | $2,760 | $820 | $1,940 |
| 2013 | $148 | $2,760 | $820 | $1,940 |
Source: Public Records
Map
Nearby Homes
- 117 A&B High St
- 0 Pearl St
- 203 Morristown Flushing Rd
- 74301 Flushing Water Works Rd
- 0 Holloway Rd State Rt 331 Unit 5067951
- 72018 Uniontown Flushing Rd
- 409 Ashton St
- 77900 Slater Rd
- 70799 Bannock Uniontown Rd
- 38400 Cadiz-Piedmont Rd
- INLOT 19 Havenwood
- 67380 National New Lafferty Rd
- 19 acres Saffell Rd
- 15 acres Saffell Rd
- 35 acres Saffell Rd
- 67290 National New Lafferty Rd
- 73310 Hazelwood Hills Rd
- 34683 Sunshine Rd
- 34810 Nelson Dr
- 34561 Sunshine Rd
- 105 High St
- 0 High & Main St Unit T9505937
- 115 Morristown St
- 117 Morristown St
- 118 Morristown St
- 110 High St
- 120 Morristown St
- 118 High St
- 122 Morristown St
- 102 A & B Northwest St
- 204 Spring St
- 105 Morristown St
- 121 Morristown St
- 101 Market St
- 101A Market St
- 101 A & 101 B Market St
- 116 E High St
- 200 Spring St
- 123 Morristown St
- 108 Northwest St
Your Personal Tour Guide
Ask me questions while you tour the home.