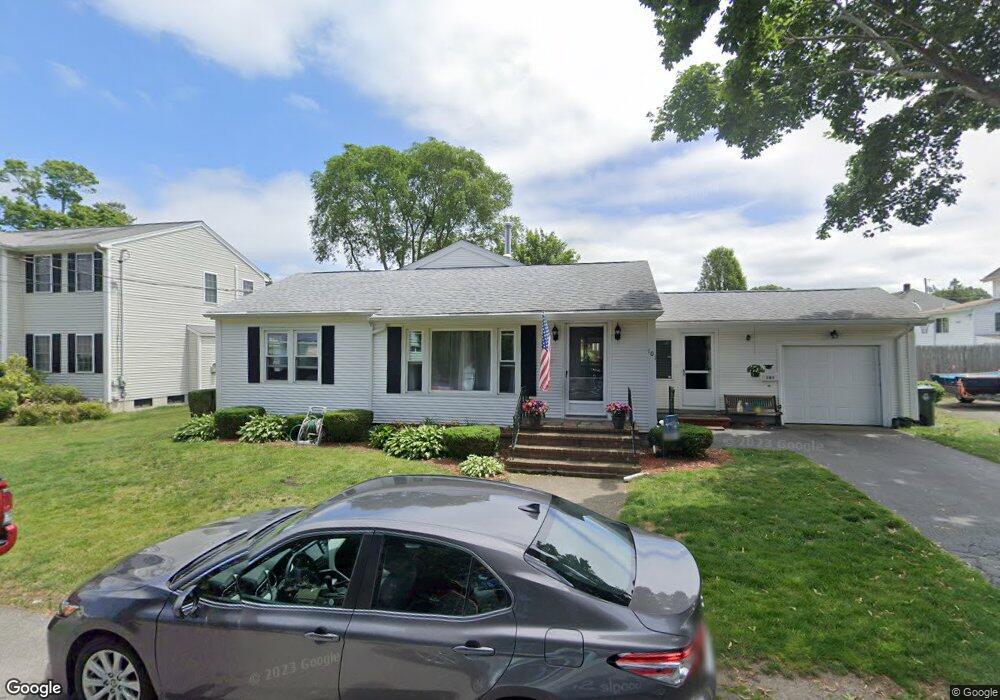
101 Hill St Fall River, MA 02723
Bank Street NeighborhoodEstimated Value: $485,000 - $551,000
2
Beds
2
Baths
2,232
Sq Ft
$231/Sq Ft
Est. Value
About This Home
This home is located at 101 Hill St, Fall River, MA 02723 and is currently estimated at $514,801, approximately $230 per square foot. 101 Hill St is a home located in Bristol County with nearby schools including Mary Fonseca Elementary School, Talbot Innovation School, and B M C Durfee High School.
Ownership History
Date
Name
Owned For
Owner Type
Purchase Details
Closed on
Apr 27, 2017
Sold by
Furtado Nancy
Bought by
Furtado Michael D and Defalco-Furtado Deborah S
Current Estimated Value
Home Financials for this Owner
Home Financials are based on the most recent Mortgage that was taken out on this home.
Original Mortgage
$180,000
Outstanding Balance
$149,093
Interest Rate
4.3%
Mortgage Type
New Conventional
Estimated Equity
$365,708
Purchase Details
Closed on
Jul 6, 2010
Sold by
Travers Tr Adeline S
Bought by
Travers Adeline S and Furtado Nancy
Purchase Details
Closed on
Jan 12, 2007
Sold by
Pasqualino Todd S
Bought by
Carvalho Keith and Gay Caroline
Home Financials for this Owner
Home Financials are based on the most recent Mortgage that was taken out on this home.
Original Mortgage
$261,250
Interest Rate
6.18%
Mortgage Type
Purchase Money Mortgage
Create a Home Valuation Report for This Property
The Home Valuation Report is an in-depth analysis detailing your home's value as well as a comparison with similar homes in the area
Home Values in the Area
Average Home Value in this Area
Purchase History
| Date | Buyer | Sale Price | Title Company |
|---|---|---|---|
| Furtado Michael D | $225,000 | -- | |
| Travers Adeline S | -- | -- | |
| Travers Adeline S | -- | -- | |
| Carvalho Keith | $125,000 | -- |
Source: Public Records
Mortgage History
| Date | Status | Borrower | Loan Amount |
|---|---|---|---|
| Open | Furtado Michael D | $180,000 | |
| Previous Owner | Carvalho Keith | $261,250 |
Source: Public Records
Tax History
| Year | Tax Paid | Tax Assessment Tax Assessment Total Assessment is a certain percentage of the fair market value that is determined by local assessors to be the total taxable value of land and additions on the property. | Land | Improvement |
|---|---|---|---|---|
| 2025 | $4,991 | $435,900 | $127,800 | $308,100 |
| 2024 | $4,673 | $406,700 | $122,900 | $283,800 |
| 2023 | $4,371 | $356,200 | $105,400 | $250,800 |
| 2022 | $3,570 | $300,400 | $95,800 | $204,600 |
| 2021 | $3,570 | $258,100 | $88,600 | $169,500 |
| 2020 | $3,423 | $236,900 | $84,800 | $152,100 |
| 2019 | $3,253 | $223,100 | $80,800 | $142,300 |
| 2018 | $2,645 | $180,900 | $79,300 | $101,600 |
| 2017 | $2,314 | $165,300 | $80,900 | $84,400 |
| 2016 | $2,243 | $164,600 | $84,200 | $80,400 |
| 2015 | $2,112 | $161,500 | $81,100 | $80,400 |
| 2014 | $2,086 | $165,800 | $85,400 | $80,400 |
Source: Public Records
Map
Nearby Homes
Your Personal Tour Guide
Ask me questions while you tour the home.