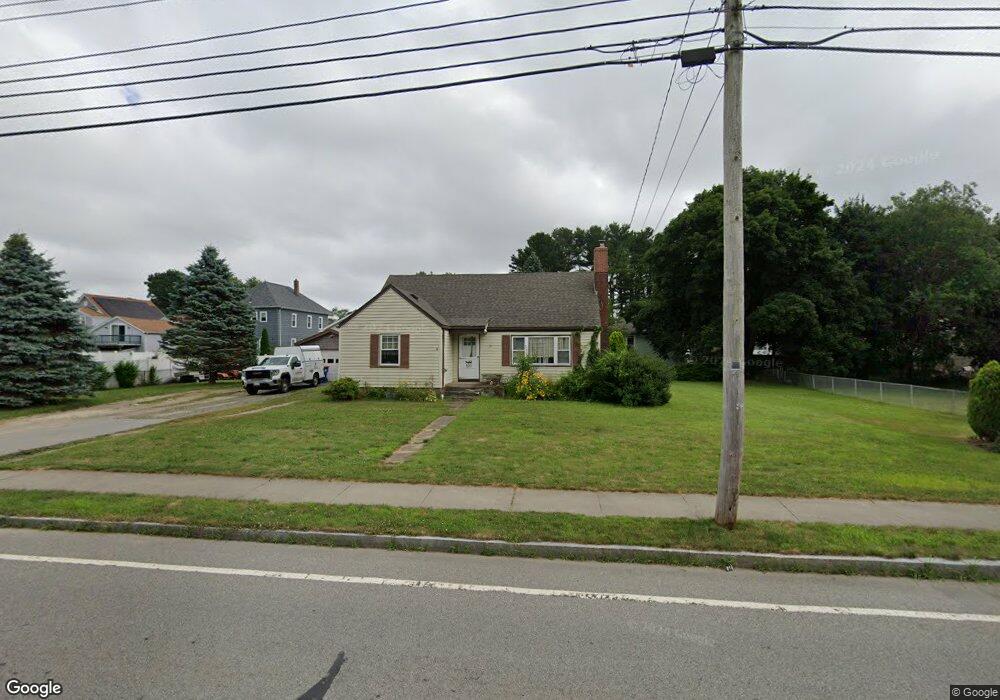
101 Howland Rd Fairhaven, MA 02719
North Fairhaven NeighborhoodEstimated Value: $441,000 - $454,000
4
Beds
1
Bath
1,092
Sq Ft
$410/Sq Ft
Est. Value
About This Home
This home is located at 101 Howland Rd, Fairhaven, MA 02719 and is currently estimated at $447,536, approximately $409 per square foot. 101 Howland Rd is a home located in Bristol County with nearby schools including Fairhaven High School, Alma Del Mar Charter School, and St. Joseph School.
Ownership History
Date
Name
Owned For
Owner Type
Purchase Details
Closed on
Jun 11, 2019
Sold by
Messier Gary
Bought by
Messier Garrett E
Current Estimated Value
Home Financials for this Owner
Home Financials are based on the most recent Mortgage that was taken out on this home.
Original Mortgage
$185,600
Outstanding Balance
$161,827
Interest Rate
3.9%
Mortgage Type
New Conventional
Estimated Equity
$285,709
Purchase Details
Closed on
Sep 30, 2016
Sold by
Bank Of New York Mello
Bought by
Messier Gary
Purchase Details
Closed on
Mar 17, 2016
Sold by
Silveria Shane F and Bank New York Mellon T
Bought by
Bank New York Mellon T
Purchase Details
Closed on
Sep 5, 2001
Sold by
Silveria Jacqueline M and Morin Ruth A
Bought by
Silveria Shane F and Silveria Leslie E
Home Financials for this Owner
Home Financials are based on the most recent Mortgage that was taken out on this home.
Original Mortgage
$159,862
Interest Rate
7.05%
Mortgage Type
Purchase Money Mortgage
Create a Home Valuation Report for This Property
The Home Valuation Report is an in-depth analysis detailing your home's value as well as a comparison with similar homes in the area
Home Values in the Area
Average Home Value in this Area
Purchase History
| Date | Buyer | Sale Price | Title Company |
|---|---|---|---|
| Messier Garrett E | $232,000 | -- | |
| Messier Garrett E | $232,000 | -- | |
| Messier Gary | $182,500 | -- | |
| Messier Gary | $182,500 | -- | |
| Bank New York Mellon T | $247,000 | -- | |
| Bank New York Mellon T | $247,000 | -- | |
| Silveria Shane F | $175,000 | -- | |
| Silveria Shane F | $175,000 | -- |
Source: Public Records
Mortgage History
| Date | Status | Borrower | Loan Amount |
|---|---|---|---|
| Open | Messier Garrett E | $185,600 | |
| Closed | Messier Garrett E | $185,600 | |
| Previous Owner | Silveria Shane F | $252,000 | |
| Previous Owner | Silveria Shane F | $233,750 | |
| Previous Owner | Silveria Shane F | $159,862 |
Source: Public Records
Tax History
| Year | Tax Paid | Tax Assessment Tax Assessment Total Assessment is a certain percentage of the fair market value that is determined by local assessors to be the total taxable value of land and additions on the property. | Land | Improvement |
|---|---|---|---|---|
| 2025 | $38 | $404,100 | $179,600 | $224,500 |
| 2024 | $3,596 | $389,600 | $179,600 | $210,000 |
| 2023 | $3,322 | $333,900 | $157,400 | $176,500 |
| 2022 | $3,217 | $314,800 | $146,300 | $168,500 |
| 2021 | $3,150 | $279,000 | $132,400 | $146,600 |
| 2020 | $3,086 | $279,000 | $132,400 | $146,600 |
| 2019 | $3,497 | $250,200 | $109,900 | $140,300 |
| 2018 | $3,578 | $239,200 | $104,700 | $134,500 |
| 2017 | $5,195 | $230,400 | $104,700 | $125,700 |
| 2016 | $2,767 | $227,200 | $104,700 | $122,500 |
| 2015 | $2,639 | $217,200 | $104,700 | $112,500 |
Source: Public Records
Map
Nearby Homes
Your Personal Tour Guide
Ask me questions while you tour the home.