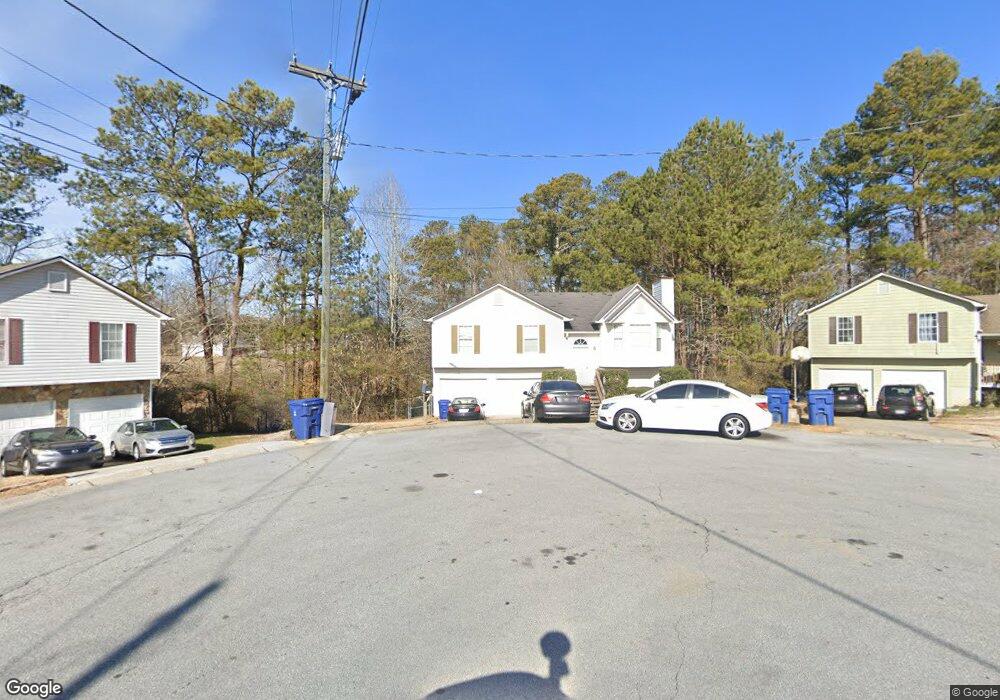
101 Ivy Crest Dr Unit 13 Dallas, GA 30157
Estimated Value: $247,000 - $283,000
3
Beds
2
Baths
1,258
Sq Ft
$217/Sq Ft
Est. Value
About This Home
This home is located at 101 Ivy Crest Dr Unit 13, Dallas, GA 30157 and is currently estimated at $272,406, approximately $216 per square foot. 101 Ivy Crest Dr Unit 13 is a home located in Paulding County with nearby schools including Allgood Elementary School, Herschel Jones Middle School, and Paulding County High School.
Ownership History
Date
Name
Owned For
Owner Type
Purchase Details
Closed on
Apr 20, 2015
Sold by
Farris Jon M
Bought by
Smalls Collette E
Current Estimated Value
Home Financials for this Owner
Home Financials are based on the most recent Mortgage that was taken out on this home.
Original Mortgage
$98,697
Outstanding Balance
$76,336
Interest Rate
3.87%
Mortgage Type
New Conventional
Estimated Equity
$196,070
Purchase Details
Closed on
Jan 22, 2007
Sold by
Dickerson Sheila D
Bought by
Farris Jon M
Home Financials for this Owner
Home Financials are based on the most recent Mortgage that was taken out on this home.
Original Mortgage
$106,400
Interest Rate
6.22%
Mortgage Type
New Conventional
Purchase Details
Closed on
Feb 21, 2003
Sold by
Davis Adrienne J
Bought by
Dickerson Shelia D
Home Financials for this Owner
Home Financials are based on the most recent Mortgage that was taken out on this home.
Original Mortgage
$108,300
Interest Rate
5.89%
Mortgage Type
FHA
Create a Home Valuation Report for This Property
The Home Valuation Report is an in-depth analysis detailing your home's value as well as a comparison with similar homes in the area
Home Values in the Area
Average Home Value in this Area
Purchase History
| Date | Buyer | Sale Price | Title Company |
|---|---|---|---|
| Smalls Collette E | $97,000 | -- | |
| Farris Jon M | $112,000 | -- | |
| Dickerson Shelia D | $110,000 | -- |
Source: Public Records
Mortgage History
| Date | Status | Borrower | Loan Amount |
|---|---|---|---|
| Open | Smalls Collette E | $98,697 | |
| Previous Owner | Farris Jon M | $106,400 | |
| Previous Owner | Dickerson Shelia D | $108,300 |
Source: Public Records
Tax History Compared to Growth
Tax History
| Year | Tax Paid | Tax Assessment Tax Assessment Total Assessment is a certain percentage of the fair market value that is determined by local assessors to be the total taxable value of land and additions on the property. | Land | Improvement |
|---|---|---|---|---|
| 2024 | $3,197 | $102,444 | $12,000 | $90,444 |
| 2023 | $3,048 | $100,788 | $12,000 | $88,788 |
| 2022 | $2,277 | $87,352 | $12,000 | $75,352 |
| 2021 | $1,904 | $65,524 | $8,000 | $57,524 |
| 2020 | $1,909 | $56,352 | $8,000 | $48,352 |
| 2019 | $1,773 | $51,680 | $8,000 | $43,680 |
| 2018 | $1,298 | $43,076 | $8,000 | $35,076 |
| 2017 | $1,407 | $40,512 | $8,000 | $32,512 |
| 2016 | $1,148 | $33,360 | $8,000 | $25,360 |
| 2015 | $896 | $30,972 | $8,000 | $22,972 |
| 2014 | $870 | $29,412 | $8,000 | $21,412 |
| 2013 | -- | $18,440 | $8,000 | $10,440 |
Source: Public Records
Map
Nearby Homes
- 218 Depot Ln
- 306 Station Dr
- 302 Ivy Brook Dr
- 201 Ivy Brook Dr
- 68 Oakdale Path
- 409 Ivy Terrace Dr
- 62 Santa Cruz Ct Unit 12
- 62 Santa Cruz Ct
- 309 Shawnee Trail Unit 17
- 309 Shawnee Trail
- 315 Shawnee Trail Unit 18
- 315 Shawnee Trail
- 59 Santa Cruz Ct Unit 11
- 59 Santa Cruz Ct
- 55 Santa Cruz Ct Unit 9
- 55 Santa Cruz Ct
- 0 Santa Cruz Ct Unit LOT 7 10506627
- 0 Santa Cruz Ct Unit 7565435
- 127 Laurel Farms Ln
- 158 Laurel Farms Ln
- 101 Ivy Crest Dr
- 103 Ivy Crest Dr
- 105 Ivy Crest Dr
- 100 Ivy Crest Dr
- 102 Ivy Crest Dr
- 107 Ivy Crest Dr
- 104 Ivy Crest Dr
- 109 Ivy Crest Dr
- 211 Depot Ln
- 106 Ivy Crest Dr
- 213 Depot Ln
- 1169 Old Villa Rica Rd
- 209 Depot Ln Unit 65
- 209 Depot Ln
- 215 Depot Ln
- 1135 Old Villa Rica Rd
- 111 Ivy Crest Dr
- 207 Depot Ln
- 0 Depot Ln Unit 8548935
- 0 Depot Ln Unit 8445114