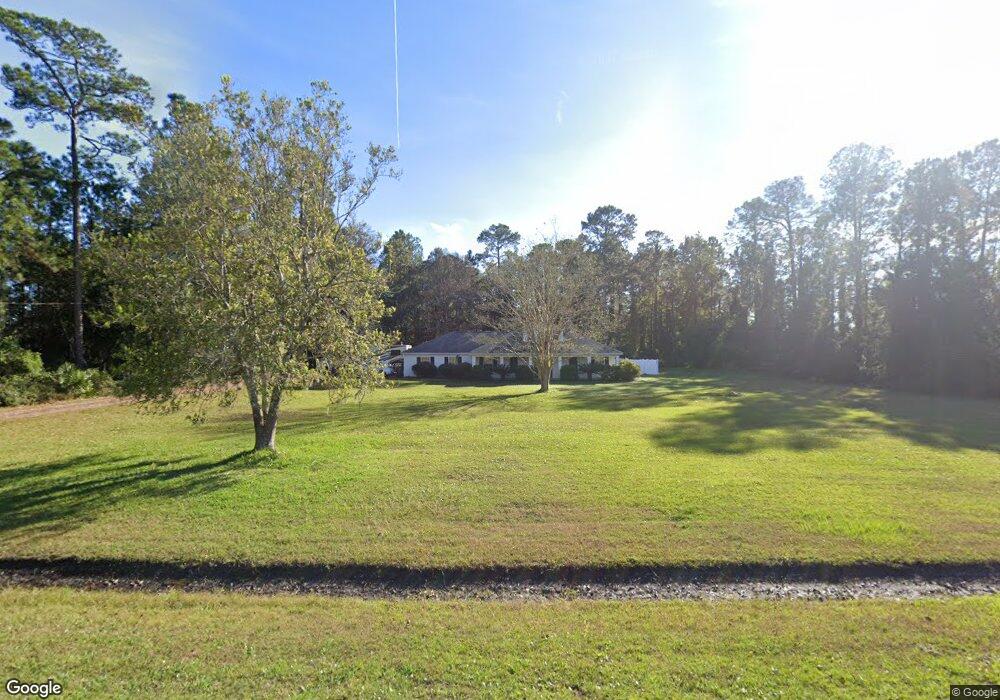
101 Joyce Dr Brunswick, GA 31525
Estimated Value: $297,000 - $399,000
3
Beds
2
Baths
2,124
Sq Ft
$162/Sq Ft
Est. Value
About This Home
This home is located at 101 Joyce Dr, Brunswick, GA 31525 and is currently estimated at $344,474, approximately $162 per square foot. 101 Joyce Dr is a home located in Glynn County with nearby schools including Greer Elementary School, Needwood Middle School, and Brunswick High School.
Ownership History
Date
Name
Owned For
Owner Type
Purchase Details
Closed on
Sep 16, 2011
Sold by
Walsh James P
Bought by
Walsh James P and Walsh Kathleen M
Current Estimated Value
Home Financials for this Owner
Home Financials are based on the most recent Mortgage that was taken out on this home.
Original Mortgage
$186,500
Outstanding Balance
$127,592
Interest Rate
4.24%
Mortgage Type
VA
Estimated Equity
$216,882
Purchase Details
Closed on
Nov 22, 2010
Sold by
Siler Michael L
Bought by
Siler Michael L and Siler Andrea Murray
Home Financials for this Owner
Home Financials are based on the most recent Mortgage that was taken out on this home.
Original Mortgage
$120,000
Interest Rate
3.71%
Mortgage Type
New Conventional
Purchase Details
Closed on
Jul 28, 2005
Sold by
Parker Richard L
Bought by
Hillman Howard S
Home Financials for this Owner
Home Financials are based on the most recent Mortgage that was taken out on this home.
Original Mortgage
$154,800
Interest Rate
5.48%
Mortgage Type
New Conventional
Create a Home Valuation Report for This Property
The Home Valuation Report is an in-depth analysis detailing your home's value as well as a comparison with similar homes in the area
Purchase History
We collect this data history from publicly available records. To have your information removed, we recommend requesting removal directly through your county’s website.
| Date | Buyer | Sale Price | Title Company |
|---|---|---|---|
| Walsh James P | -- | -- | |
| Walsh James P | $186,500 | -- | |
| Siler Michael L | -- | -- | |
| Siler Michael L | $160,000 | -- | |
| Hillman Howard S | $193,500 | -- |
Source: Public Records
Mortgage History
We collect this data history from publicly available records. To have your information removed, we recommend requesting removal directly through your county’s website.
| Date | Status | Borrower | Loan Amount |
|---|---|---|---|
| Open | Walsh James P | $186,500 | |
| Closed | Walsh James P | $186,500 | |
| Previous Owner | Siler Michael L | $120,000 | |
| Previous Owner | Hillman Howard S | $154,800 |
Source: Public Records
Tax History
| Year | Tax Paid | Tax Assessment Tax Assessment Total Assessment is a certain percentage of the fair market value that is determined by local assessors to be the total taxable value of land and additions on the property. | Land | Improvement |
|---|---|---|---|---|
| 2025 | $2,186 | $87,160 | $13,520 | $73,640 |
| 2024 | $1,915 | $76,360 | $4,920 | $71,440 |
| 2023 | $2,001 | $76,360 | $4,920 | $71,440 |
| 2022 | $2,040 | $76,360 | $4,920 | $71,440 |
| 2021 | $2,076 | $75,440 | $5,160 | $70,280 |
| 2020 | $2,095 | $75,440 | $5,160 | $70,280 |
| 2019 | $2,095 | $75,440 | $5,160 | $70,280 |
| 2018 | $2,092 | $75,320 | $5,040 | $70,280 |
| 2017 | $2,092 | $75,320 | $5,040 | $70,280 |
| 2016 | $1,933 | $75,320 | $5,040 | $70,280 |
| 2015 | $1,959 | $76,120 | $8,320 | $67,800 |
| 2014 | $1,959 | $76,120 | $8,320 | $67,800 |
Source: Public Records
Map
Nearby Homes
- 103 Cartwright Cir
- 112 Meadows Way
- 101 Pheasant Dr
- 138 Thornhill Dr
- 111 Thornhill Dr
- 134 Dark Creek Ln
- 110 Pine Wood Rd
- 101 Winton Dr
- 230 Yacht Rd
- 115 Winton Dr
- 116 Smith Rd
- 303 Hidden Harbor Way
- 20 Hidden Harbor Rd
- 26 Hidden Harbor Rd
- 126 Drayton Cir
- 60 Powers Landing
- 147 Drayton Cir
- 65 Greyfield Dr
- 279 King Cotton Rd
- 105 Belle Point Pkwy
Your Personal Tour Guide
Ask me questions while you tour the home.