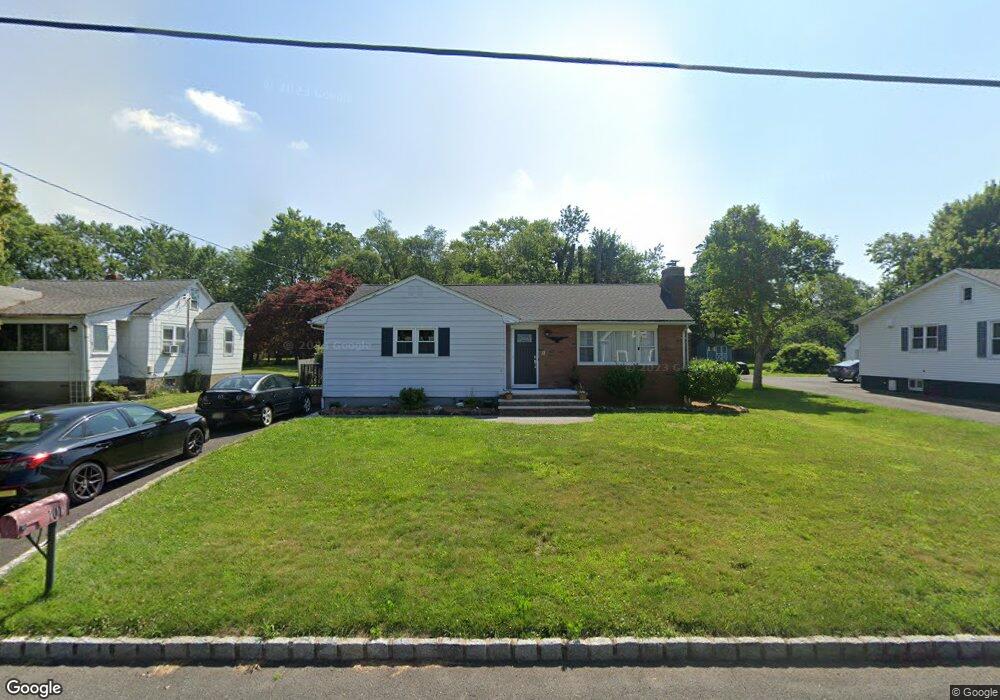
101 Linden St Bridgewater, NJ 08807
Estimated Value: $476,000 - $521,816
--
Bed
--
Bath
1,181
Sq Ft
$424/Sq Ft
Est. Value
About This Home
This home is located at 101 Linden St, Bridgewater, NJ 08807 and is currently estimated at $500,454, approximately $423 per square foot. 101 Linden St is a home located in Somerset County with nearby schools including Bradley Gardens Primary School, Eisenhower Intermediate School, and Bridgewater-Raritan Middle School.
Ownership History
Date
Name
Owned For
Owner Type
Purchase Details
Closed on
Apr 3, 2007
Sold by
Kunze Donna
Bought by
Silva Anthony J and Silva Eileen W
Current Estimated Value
Home Financials for this Owner
Home Financials are based on the most recent Mortgage that was taken out on this home.
Original Mortgage
$250,000
Outstanding Balance
$151,986
Interest Rate
6.25%
Mortgage Type
Purchase Money Mortgage
Estimated Equity
$348,468
Create a Home Valuation Report for This Property
The Home Valuation Report is an in-depth analysis detailing your home's value as well as a comparison with similar homes in the area
Home Values in the Area
Average Home Value in this Area
Purchase History
| Date | Buyer | Sale Price | Title Company |
|---|---|---|---|
| Silva Anthony J | $338,000 | None Available |
Source: Public Records
Mortgage History
| Date | Status | Borrower | Loan Amount |
|---|---|---|---|
| Open | Silva Anthony J | $250,000 |
Source: Public Records
Tax History Compared to Growth
Tax History
| Year | Tax Paid | Tax Assessment Tax Assessment Total Assessment is a certain percentage of the fair market value that is determined by local assessors to be the total taxable value of land and additions on the property. | Land | Improvement |
|---|---|---|---|---|
| 2025 | $7,157 | $372,500 | $170,600 | $201,900 |
| 2024 | $7,157 | $359,300 | $170,600 | $188,700 |
| 2023 | $6,526 | $321,300 | $170,600 | $150,700 |
| 2022 | $5,969 | $282,600 | $165,600 | $117,000 |
| 2021 | $5,915 | $275,900 | $165,600 | $110,300 |
| 2020 | $5,908 | $274,400 | $165,600 | $108,800 |
| 2019 | $5,915 | $272,200 | $165,600 | $106,600 |
| 2018 | $5,849 | $269,900 | $165,600 | $104,300 |
| 2017 | $5,574 | $257,000 | $165,600 | $91,400 |
| 2016 | $5,361 | $251,000 | $165,600 | $85,400 |
| 2015 | $5,322 | $249,400 | $165,600 | $83,800 |
| 2014 | $5,229 | $241,200 | $165,600 | $75,600 |
Source: Public Records
Map
Nearby Homes