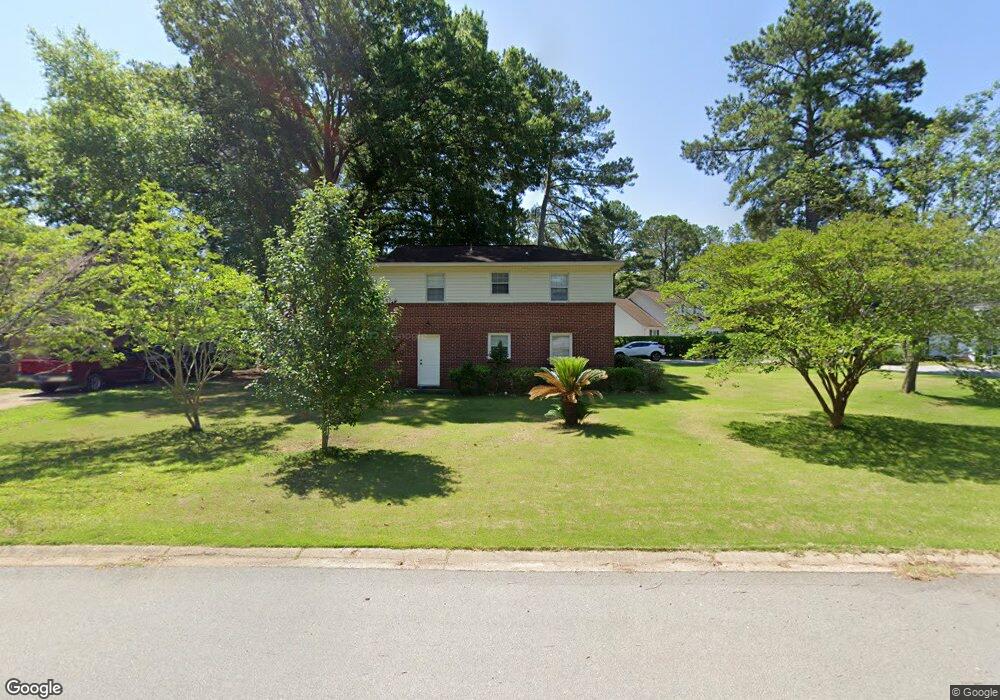
101 Lockshire Ct Columbia, SC 29212
Seven Oaks NeighborhoodEstimated Value: $196,000 - $264,000
4
Beds
3
Baths
1,980
Sq Ft
$121/Sq Ft
Est. Value
About This Home
This home is located at 101 Lockshire Ct, Columbia, SC 29212 and is currently estimated at $239,153, approximately $120 per square foot. 101 Lockshire Ct is a home located in Lexington County with nearby schools including Leaphart Elementary School, Irmo Middle, and Irmo High.
Ownership History
Date
Name
Owned For
Owner Type
Purchase Details
Closed on
Jul 31, 2017
Sold by
Avp Investments Llc
Bought by
Va Tek Llc
Current Estimated Value
Home Financials for this Owner
Home Financials are based on the most recent Mortgage that was taken out on this home.
Original Mortgage
$6,000
Outstanding Balance
$1,337
Interest Rate
3.88%
Mortgage Type
Unknown
Estimated Equity
$237,816
Purchase Details
Closed on
Mar 2, 2017
Sold by
Burgess Betty J
Bought by
Avp Investments Llc
Purchase Details
Closed on
Jan 30, 2014
Sold by
Gordon Bobby
Bought by
Burgess Betty J
Purchase Details
Closed on
Jul 19, 2013
Sold by
Gifford Demetria S and Lodge Sonya S
Bought by
Gordon Bobby
Purchase Details
Closed on
Aug 18, 2010
Sold by
Estate Of Paul Seabroks Jr and Gifford Demetria S
Bought by
Gifford Demetria S and Lodge Sonya S
Purchase Details
Closed on
Oct 13, 2005
Sold by
Seabrooks Paul
Bought by
Seabrooks Paul
Create a Home Valuation Report for This Property
The Home Valuation Report is an in-depth analysis detailing your home's value as well as a comparison with similar homes in the area
Home Values in the Area
Average Home Value in this Area
Purchase History
| Date | Buyer | Sale Price | Title Company |
|---|---|---|---|
| Va Tek Llc | $135,000 | None Available | |
| Avp Investments Llc | $85,000 | None Available | |
| Burgess Betty J | $72,500 | -- | |
| Gordon Bobby | $2,500 | -- | |
| Gifford Demetria S | -- | -- | |
| Seabrooks Paul | -- | -- |
Source: Public Records
Mortgage History
| Date | Status | Borrower | Loan Amount |
|---|---|---|---|
| Open | Va Tek Llc | $6,000 | |
| Open | Va Tek Llc | $128,632 |
Source: Public Records
Tax History Compared to Growth
Tax History
| Year | Tax Paid | Tax Assessment Tax Assessment Total Assessment is a certain percentage of the fair market value that is determined by local assessors to be the total taxable value of land and additions on the property. | Land | Improvement |
|---|---|---|---|---|
| 2024 | $832 | $5,425 | $1,200 | $4,225 |
| 2023 | $832 | $5,425 | $1,200 | $4,225 |
| 2022 | $850 | $5,425 | $1,200 | $4,225 |
| 2020 | $885 | $5,425 | $1,200 | $4,225 |
| 2019 | $898 | $5,395 | $720 | $4,675 |
| 2018 | $788 | $5,395 | $720 | $4,675 |
| 2017 | $412 | $2,900 | $720 | $2,180 |
| 2016 | $1,776 | $4,350 | $1,080 | $3,270 |
| 2014 | $2,189 | $5,571 | $1,440 | $4,131 |
| 2013 | -- | $3,710 | $960 | $2,750 |
Source: Public Records
Map
Nearby Homes
- 105 Garmony Cir
- 319 Valcour Rd
- 113 Lyndhurst Rd
- 107 Lyndhurst Ct
- 700 Lockner Rd
- 806 Lockner Rd
- 203 Broken Hill Rd
- 513 Pitney Rd
- 232 Piney Grove Rd
- 5227 Bush River Rd
- 183 Jefferson Place
- 224 Linsbury Cir
- 340 Avery Place Dr
- 401 Quail Trace Dr
- 612 Lewisham Rd
- 5802 Mcmillan Cir
- 224 Stirlington Rd
- 217 Woodwinds Dr
- 1112 Baffin Bay Rd
- 101 Woodwinds Ct
- 213 Lockshire Rd
- 103 Lockshire Ct
- 207 Lockshire Rd
- 216 Lockshire Rd
- 100 Lockshire Ct
- 121 Drury Ln
- 104 Lockshire Ct
- 208 Lockshire Rd
- 102 Lockshire Ct
- 205 Lockshire Rd
- 301 Lockshire Rd
- 201 Lingstrom Ln
- 637 Garmony Rd
- 206 Lockshire Rd
- 119 Garmony Cir
- 207 Lingstrom Ln
- 203 Lockshire Rd
- 125 Garmony Cir
- 307 Lockshire Rd
- 204 Lockshire Rd