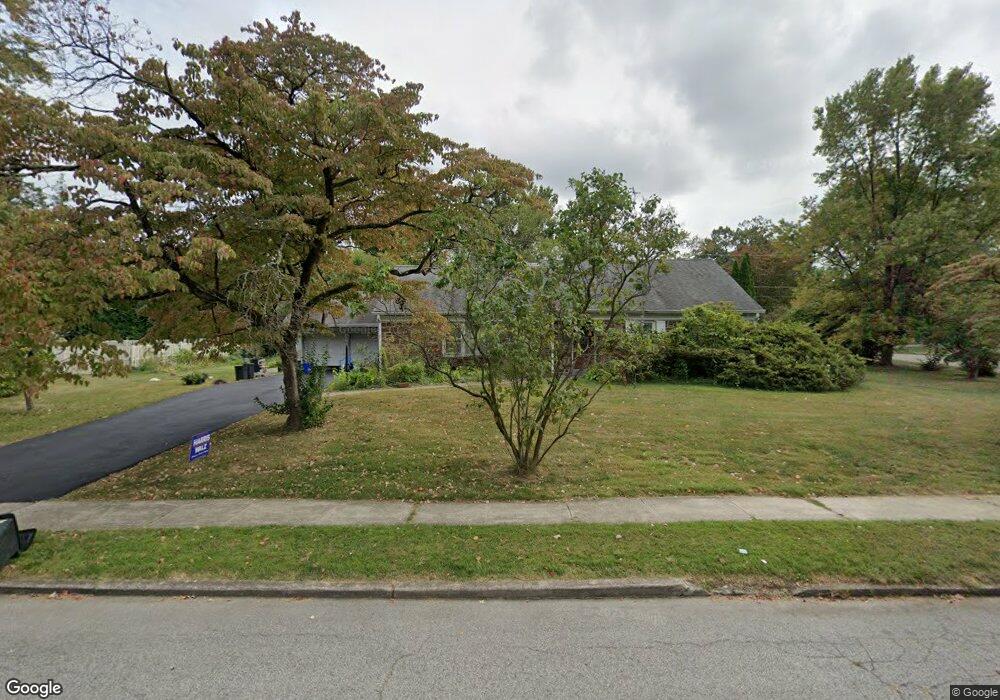
101 Morlyn Ave Bryn Mawr, PA 19010
Estimated Value: $689,000 - $1,030,000
4
Beds
3
Baths
2,089
Sq Ft
$407/Sq Ft
Est. Value
About This Home
This home is located at 101 Morlyn Ave, Bryn Mawr, PA 19010 and is currently estimated at $850,970, approximately $407 per square foot. 101 Morlyn Ave is a home located in Delaware County with nearby schools including Coopertown Elementary School, Haverford Middle School, and Haverford Senior High School.
Ownership History
Date
Name
Owned For
Owner Type
Purchase Details
Closed on
Nov 7, 2014
Sold by
Nestle Jennifer J
Bought by
Nestle Jennifer J and Powers Jeffrey
Current Estimated Value
Home Financials for this Owner
Home Financials are based on the most recent Mortgage that was taken out on this home.
Original Mortgage
$197,500
Outstanding Balance
$108,230
Interest Rate
3.62%
Mortgage Type
Adjustable Rate Mortgage/ARM
Estimated Equity
$742,740
Purchase Details
Closed on
Aug 31, 1999
Sold by
Tareen Kamran and Mirza Natasha
Bought by
Nestle Jennifer J
Home Financials for this Owner
Home Financials are based on the most recent Mortgage that was taken out on this home.
Original Mortgage
$190,000
Interest Rate
7.5%
Mortgage Type
Purchase Money Mortgage
Purchase Details
Closed on
Oct 24, 1995
Sold by
Uzzell Rudyard Stephen and Uzzell Sarah S H
Bought by
Tareen Kamran and Mirza Natasha
Home Financials for this Owner
Home Financials are based on the most recent Mortgage that was taken out on this home.
Original Mortgage
$175,750
Interest Rate
7.6%
Mortgage Type
Purchase Money Mortgage
Create a Home Valuation Report for This Property
The Home Valuation Report is an in-depth analysis detailing your home's value as well as a comparison with similar homes in the area
Home Values in the Area
Average Home Value in this Area
Purchase History
| Date | Buyer | Sale Price | Title Company |
|---|---|---|---|
| Nestle Jennifer J | -- | None Available | |
| Nestle Jennifer J | $237,500 | Commonwealth Land Title Ins | |
| Tareen Kamran | $185,000 | -- |
Source: Public Records
Mortgage History
| Date | Status | Borrower | Loan Amount |
|---|---|---|---|
| Open | Nestle Jennifer J | $197,500 | |
| Closed | Nestle Jennifer J | $190,000 | |
| Previous Owner | Tareen Kamran | $175,750 | |
| Closed | Nestle Jennifer J | $35,600 |
Source: Public Records
Tax History Compared to Growth
Tax History
| Year | Tax Paid | Tax Assessment Tax Assessment Total Assessment is a certain percentage of the fair market value that is determined by local assessors to be the total taxable value of land and additions on the property. | Land | Improvement |
|---|---|---|---|---|
| 2025 | $13,398 | $521,060 | $161,380 | $359,680 |
| 2024 | $13,398 | $521,060 | $161,380 | $359,680 |
| 2023 | $13,017 | $521,060 | $161,380 | $359,680 |
| 2022 | $12,713 | $521,060 | $161,380 | $359,680 |
| 2021 | $20,711 | $521,060 | $161,380 | $359,680 |
| 2020 | $11,141 | $239,700 | $82,290 | $157,410 |
| 2019 | $10,935 | $239,700 | $82,290 | $157,410 |
| 2018 | $10,748 | $239,700 | $0 | $0 |
| 2017 | $10,520 | $239,700 | $0 | $0 |
| 2016 | $1,315 | $239,700 | $0 | $0 |
| 2015 | $1,342 | $239,700 | $0 | $0 |
| 2014 | $1,342 | $239,700 | $0 | $0 |
Source: Public Records
Map
Nearby Homes
- 128 Clemson Rd
- 258 Lee Cir
- 145 Landover Rd
- 732 Buck Ln
- 741 County Line Rd
- 815 Penn St
- 14 Westview Rd
- 75 S Merion Ave
- 27 S Merion Ave
- 50 Prospect Ave
- 390 S Bryn Mawr Ave
- 28 S Warner Ave
- 62 Parkridge Dr Unit 62
- 133 Quaker Ln
- 67 Parkridge Dr
- 307 B B000 Summit Dr Unit B
- 202 Summit Dr Unit B
- 103 Summit Dr Unit B
- 922 Montgomery Ave Unit B2
- 601 Montgomery Ave Unit 204