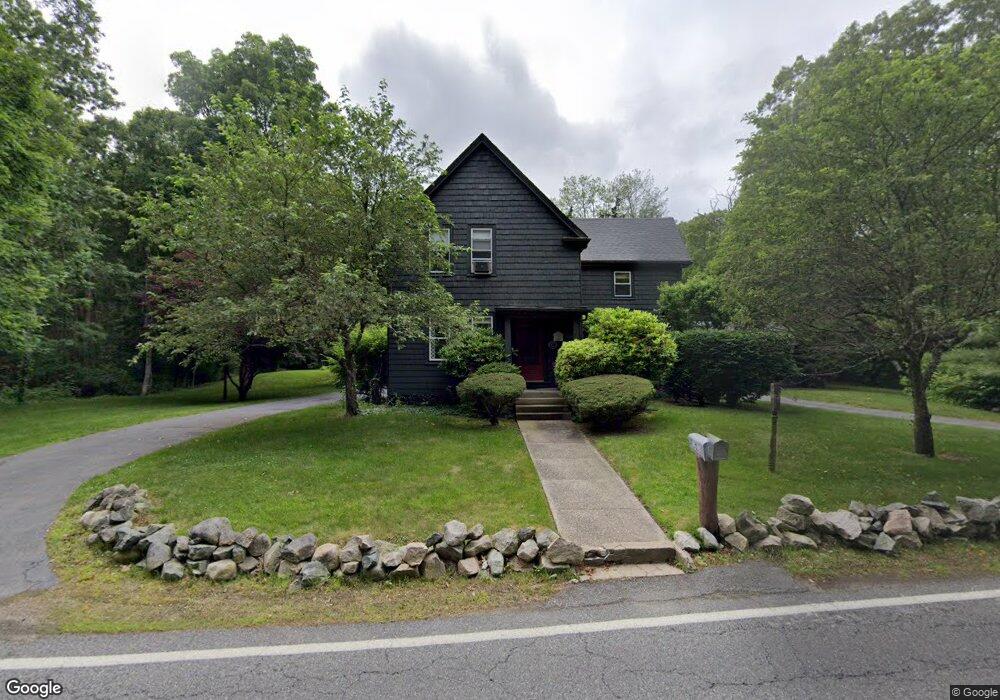
101 Morse St Foxboro, MA 02035
Estimated Value: $587,000 - $653,000
3
Beds
2
Baths
1,532
Sq Ft
$400/Sq Ft
Est. Value
About This Home
This home is located at 101 Morse St, Foxboro, MA 02035 and is currently estimated at $612,048, approximately $399 per square foot. 101 Morse St is a home located in Norfolk County with nearby schools including Foxborough High School, Hands-On-Montessori School, and St Mary's Catholic School.
Ownership History
Date
Name
Owned For
Owner Type
Purchase Details
Closed on
Oct 6, 2015
Sold by
Howe Teresa G
Bought by
Teresa Howe Ret
Current Estimated Value
Purchase Details
Closed on
Jul 17, 1974
Bought by
Teresa Howe Ret
Create a Home Valuation Report for This Property
The Home Valuation Report is an in-depth analysis detailing your home's value as well as a comparison with similar homes in the area
Home Values in the Area
Average Home Value in this Area
Purchase History
| Date | Buyer | Sale Price | Title Company |
|---|---|---|---|
| Teresa Howe Ret | -- | -- | |
| Teresa Howe Ret | -- | -- |
Source: Public Records
Mortgage History
| Date | Status | Borrower | Loan Amount |
|---|---|---|---|
| Previous Owner | Teresa Howe Ret | $119,000 | |
| Previous Owner | Teresa Howe Ret | $135,900 | |
| Previous Owner | Teresa Howe Ret | $25,050 | |
| Previous Owner | Teresa Howe Ret | $115,000 |
Source: Public Records
Tax History
| Year | Tax Paid | Tax Assessment Tax Assessment Total Assessment is a certain percentage of the fair market value that is determined by local assessors to be the total taxable value of land and additions on the property. | Land | Improvement |
|---|---|---|---|---|
| 2025 | $6,138 | $464,300 | $238,300 | $226,000 |
| 2024 | $6,134 | $454,000 | $256,400 | $197,600 |
| 2023 | $6,031 | $424,400 | $244,400 | $180,000 |
| 2022 | $5,757 | $396,500 | $219,500 | $177,000 |
| 2021 | $5,641 | $382,700 | $208,600 | $174,100 |
| 2020 | $5,576 | $382,700 | $208,600 | $174,100 |
| 2019 | $5,523 | $375,700 | $209,100 | $166,600 |
| 2018 | $5,059 | $347,200 | $198,800 | $148,400 |
| 2017 | $4,903 | $326,000 | $195,500 | $130,500 |
| 2016 | $4,784 | $322,800 | $188,400 | $134,400 |
| 2015 | $4,317 | $284,200 | $140,900 | $143,300 |
| 2014 | $4,260 | $284,200 | $140,900 | $143,300 |
Source: Public Records
Map
Nearby Homes
- 619 N Main St
- 261 East St
- 25 Kingman Ave
- 9 Independence Dr Unit 9
- 81 Chilson Ave
- 22 Pleasant St Unit B
- 122 Samoset Ave
- 356 Central St
- 266 N Main St Unit 3
- 46 Hope St
- 150 Rumford Ave Unit 110
- 233 Central St
- 166 Chauncy St
- 28 Court St
- 26 Fredric Ln
- 631 East St Unit L101
- 97 East St
- 44 Fairfield Park Unit 44
- 157 Central St
- 13 Summerville Rd Unit 13
Your Personal Tour Guide
Ask me questions while you tour the home.