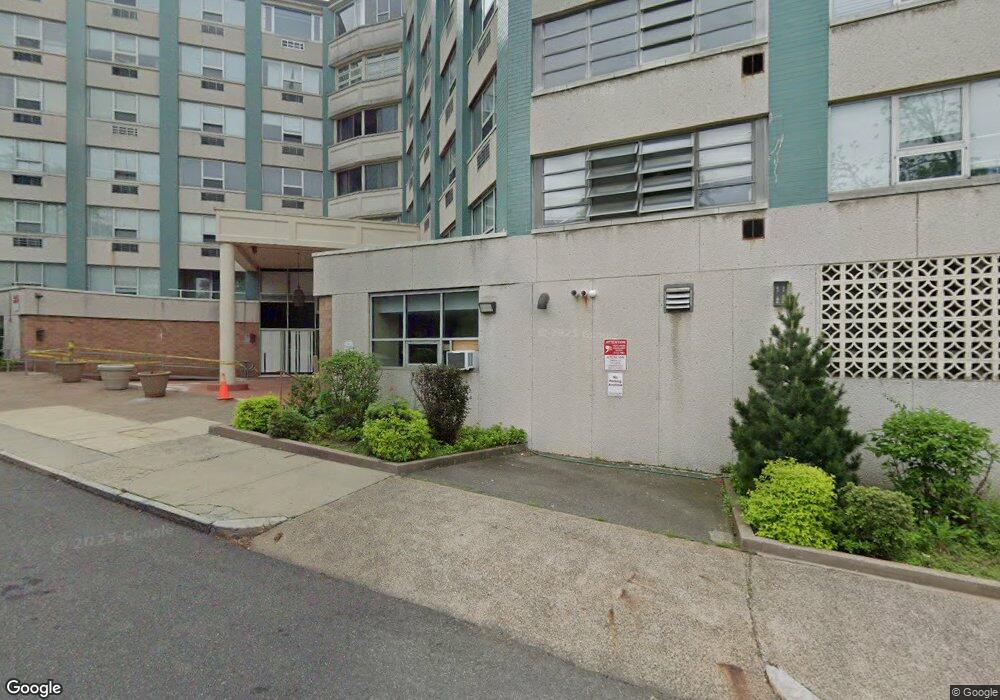
Mulberry House 101 Mulberry St Unit 120 Springfield, MA 01105
Maple-High Six Corners NeighborhoodEstimated Value: $86,000 - $137,000
1
Bed
1
Bath
590
Sq Ft
$181/Sq Ft
Est. Value
About This Home
This home is located at 101 Mulberry St Unit 120, Springfield, MA 01105 and is currently estimated at $106,569, approximately $180 per square foot. 101 Mulberry St Unit 120 is a home located in Hampden County with nearby schools including Milton Bradley School, South End Middle School, and High School Of Commerce.
Ownership History
Date
Name
Owned For
Owner Type
Purchase Details
Closed on
Jun 1, 2009
Sold by
Merced Mario
Bought by
Hillios Stewart T and Hillios Carol A
Current Estimated Value
Home Financials for this Owner
Home Financials are based on the most recent Mortgage that was taken out on this home.
Original Mortgage
$2,400
Outstanding Balance
$1,525
Interest Rate
4.87%
Mortgage Type
Purchase Money Mortgage
Estimated Equity
$105,044
Purchase Details
Closed on
Jun 19, 2001
Sold by
Duncan Ned O
Bought by
Della Ripa Anthony A
Purchase Details
Closed on
Apr 21, 1999
Sold by
Muslim Abdussala
Bought by
Duncan Ned O
Purchase Details
Closed on
Sep 24, 1997
Sold by
Perron Lanny
Bought by
Clark Stella G
Purchase Details
Closed on
Jul 10, 1995
Sold by
Mlq Investors Lp
Bought by
Donoghue Steven P
Purchase Details
Closed on
Aug 10, 1994
Sold by
Baum David M
Bought by
Mlq Investors Lp
Create a Home Valuation Report for This Property
The Home Valuation Report is an in-depth analysis detailing your home's value as well as a comparison with similar homes in the area
Home Values in the Area
Average Home Value in this Area
Purchase History
| Date | Buyer | Sale Price | Title Company |
|---|---|---|---|
| Hillios Stewart T | $30,000 | -- | |
| Della Ripa Anthony A | $15,000 | -- | |
| Duncan Ned O | $6,500 | -- | |
| Clark Stella G | $2,000 | -- | |
| Donoghue Steven P | $6,500 | -- | |
| Mlq Investors Lp | $10,000 | -- |
Source: Public Records
Mortgage History
| Date | Status | Borrower | Loan Amount |
|---|---|---|---|
| Open | Hillios Stewart T | $2,400 |
Source: Public Records
Tax History Compared to Growth
Tax History
| Year | Tax Paid | Tax Assessment Tax Assessment Total Assessment is a certain percentage of the fair market value that is determined by local assessors to be the total taxable value of land and additions on the property. | Land | Improvement |
|---|---|---|---|---|
| 2025 | $1,510 | $96,300 | $0 | $96,300 |
| 2024 | $1,254 | $78,100 | $0 | $78,100 |
| 2023 | $1,200 | $70,400 | $0 | $70,400 |
| 2022 | $1,029 | $54,700 | $0 | $54,700 |
| 2021 | $680 | $36,000 | $0 | $36,000 |
| 2020 | $373 | $19,100 | $0 | $19,100 |
| 2019 | $409 | $20,800 | $0 | $20,800 |
| 2018 | $783 | $39,800 | $0 | $39,800 |
| 2017 | $839 | $42,700 | $0 | $42,700 |
| 2016 | $839 | $42,700 | $0 | $42,700 |
| 2015 | $783 | $39,800 | $0 | $39,800 |
Source: Public Records
About Mulberry House
Map
Nearby Homes
- 101 Mulberry St Unit 112
- 91 Mulberry St
- 265 Union St
- 167 Maple St
- 3 Ashley St
- 0 Central St
- 235 State St Unit 409
- 235 State St Unit 220
- 79 Oak St
- 63 Oak St
- 57 Morris St Unit 204
- 68 Ashley St
- 45 Morris St Unit 106
- 39 Morris St Unit 103
- 56 Central St Unit 504
- 19 Pine Street Ct
- 42 Queen St
- 54 Central St Unit 506
- 308 Maple St
- 52 Central St Unit 504
- 101 Mulberry St Unit 607
- 101 Mulberry St Unit 606
- 101 Mulberry St Unit 605
- 101 Mulberry St Unit 604
- 101 Mulberry St Unit 603
- 101 Mulberry St Unit 602
- 101 Mulberry St Unit 601
- 101 Mulberry St Unit 520
- 101 Mulberry St Unit 519
- 101 Mulberry St Unit 517
- 101 Mulberry St Unit 516
- 101 Mulberry St Unit 515
- 101 Mulberry St Unit 514
- 101 Mulberry St Unit 513
- 101 Mulberry St Unit 512
- 101 Mulberry St Unit 511
- 101 Mulberry St Unit 510
- 101 Mulberry St Unit 509
- 101 Mulberry St Unit 508
- 101 Mulberry St Unit 507