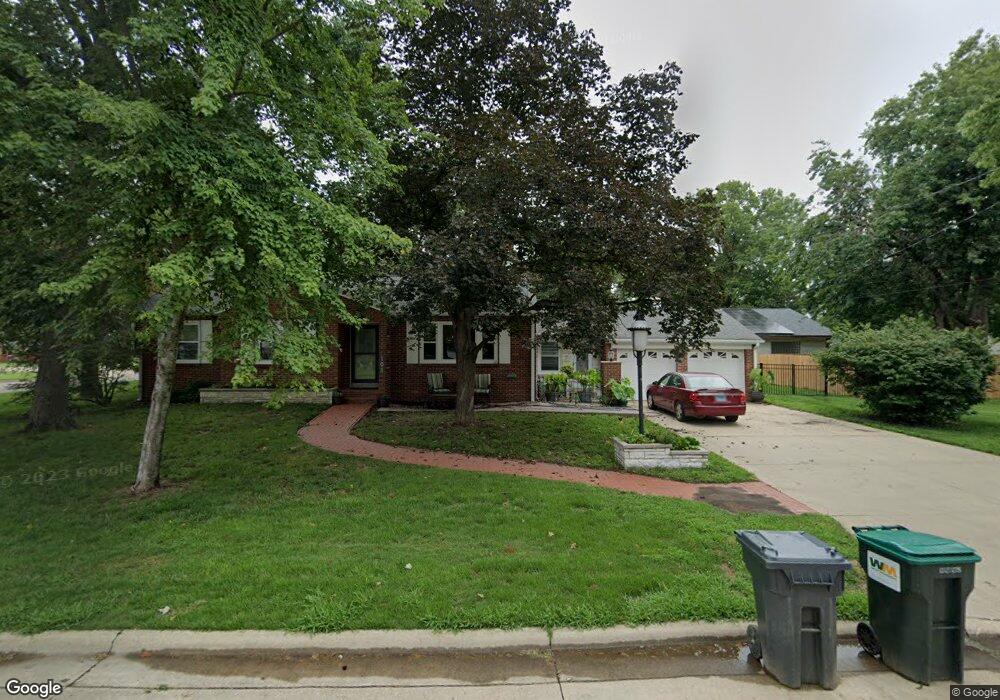
101 N 2nd St Breese, IL 62230
Estimated Value: $207,000 - $258,286
--
Bed
--
Bath
1,755
Sq Ft
$137/Sq Ft
Est. Value
About This Home
This home is located at 101 N 2nd St, Breese, IL 62230 and is currently estimated at $240,572, approximately $137 per square foot. 101 N 2nd St is a home located in Clinton County with nearby schools including Breese ESD #12, Beckemeyer Elementary School, and Central Community High School.
Ownership History
Date
Name
Owned For
Owner Type
Purchase Details
Closed on
Nov 12, 2015
Sold by
Becker John B and Foppe Margaret
Bought by
Niemeyer Bradley G and Niemeyer Amy L
Current Estimated Value
Purchase Details
Closed on
Jul 1, 2015
Sold by
Becker John B and Foppe Margaret
Bought by
Niemeyer Bradley G and Niemeyer May L
Home Financials for this Owner
Home Financials are based on the most recent Mortgage that was taken out on this home.
Original Mortgage
$142,500
Interest Rate
3.82%
Mortgage Type
New Conventional
Create a Home Valuation Report for This Property
The Home Valuation Report is an in-depth analysis detailing your home's value as well as a comparison with similar homes in the area
Home Values in the Area
Average Home Value in this Area
Purchase History
| Date | Buyer | Sale Price | Title Company |
|---|---|---|---|
| Niemeyer Bradley G | -- | None Available | |
| Niemeyer Bradley G | $150,000 | Community Title |
Source: Public Records
Mortgage History
| Date | Status | Borrower | Loan Amount |
|---|---|---|---|
| Previous Owner | Niemeyer Bradley G | $142,500 |
Source: Public Records
Tax History Compared to Growth
Tax History
| Year | Tax Paid | Tax Assessment Tax Assessment Total Assessment is a certain percentage of the fair market value that is determined by local assessors to be the total taxable value of land and additions on the property. | Land | Improvement |
|---|---|---|---|---|
| 2024 | $5,452 | $85,150 | $16,580 | $68,570 |
| 2023 | $5,452 | $74,720 | $15,640 | $59,080 |
| 2022 | $4,994 | $67,930 | $14,220 | $53,710 |
| 2021 | $4,496 | $64,690 | $13,540 | $51,150 |
| 2020 | $4,402 | $62,200 | $13,020 | $49,180 |
| 2019 | $4,325 | $62,200 | $13,020 | $49,180 |
| 2018 | $3,748 | $52,094 | $14,165 | $37,929 |
| 2017 | $3,640 | $50,090 | $13,620 | $36,470 |
| 2016 | $3,611 | $50,090 | $13,620 | $36,470 |
| 2015 | -- | $50,090 | $13,620 | $36,470 |
Source: Public Records
Map
Nearby Homes