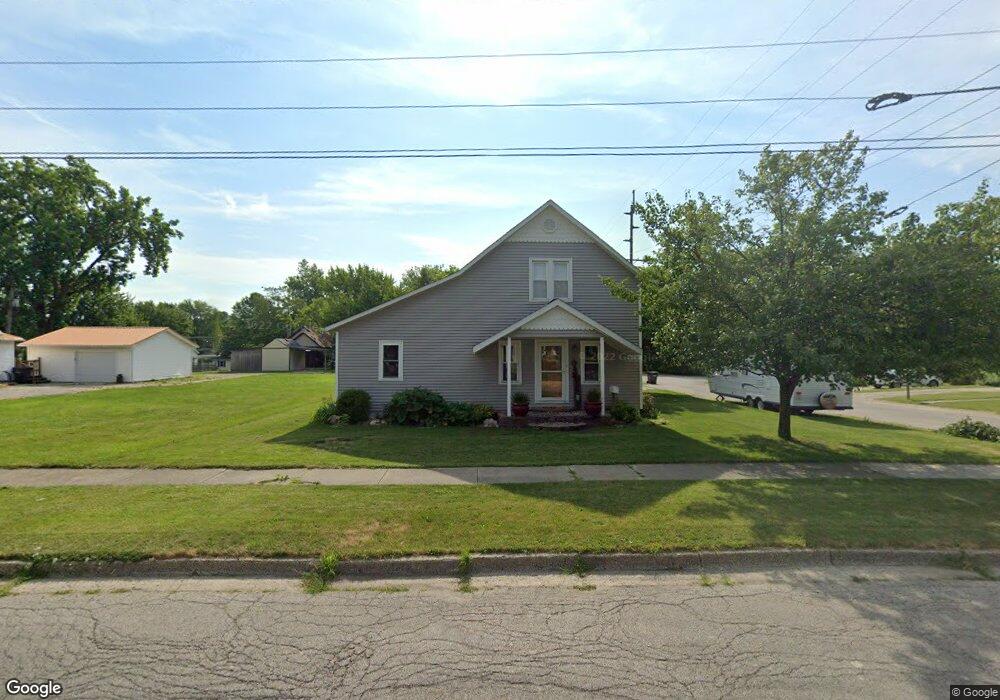
101 N 2nd St Garrett, IN 46738
Estimated Value: $159,000 - $201,873
2
Beds
1
Bath
2,112
Sq Ft
$89/Sq Ft
Est. Value
About This Home
This home is located at 101 N 2nd St, Garrett, IN 46738 and is currently estimated at $187,218, approximately $88 per square foot. 101 N 2nd St is a home located in DeKalb County with nearby schools including J.E. Ober Elementary School, Garrett Middle School, and Garrett High School.
Ownership History
Date
Name
Owned For
Owner Type
Purchase Details
Closed on
Oct 27, 2023
Sold by
Bauer Cody S and Bauer Caitlyn
Bought by
Bauer Caitlyn
Current Estimated Value
Purchase Details
Closed on
Apr 15, 2022
Sold by
Kapp Anita
Bought by
Malloch Steven
Home Financials for this Owner
Home Financials are based on the most recent Mortgage that was taken out on this home.
Original Mortgage
$142,373
Interest Rate
4.42%
Mortgage Type
FHA
Purchase Details
Closed on
Apr 24, 2017
Sold by
Malloch James R and Malloch Margaret A
Bought by
Malloch Steven and Malloch Anita
Purchase Details
Closed on
Jun 1, 2015
Sold by
Fleckenstein Donald and Fleckenstein Cheryl
Bought by
Malloch Trust
Purchase Details
Closed on
Oct 10, 2008
Sold by
Hargrave James
Bought by
Fleckenstein Donald and Fleckenstein Cheryl
Purchase Details
Closed on
Jul 29, 2008
Sold by
Dennis Sheriff John W
Bought by
Deutsche Bank National Trust C As
Purchase Details
Closed on
Mar 8, 2002
Sold by
Teller Edwin G
Bought by
Brown Gerald A
Create a Home Valuation Report for This Property
The Home Valuation Report is an in-depth analysis detailing your home's value as well as a comparison with similar homes in the area
Home Values in the Area
Average Home Value in this Area
Purchase History
| Date | Buyer | Sale Price | Title Company |
|---|---|---|---|
| Bauer Caitlyn | -- | None Listed On Document | |
| Malloch Steven | -- | Lightner Zachary M | |
| Malloch Steven | -- | None Available | |
| Malloch Trust | -- | -- | |
| Fleckenstein Donald | $34,900 | Single Source | |
| Fleckenstein Donald | $34,900 | None Available | |
| Deutsche Bank National Trust C As | -- | Dekalb Co Sheriffs Dept | |
| Deutsche Bank National Trust Co | $45,776 | None Available | |
| Brown Gerald A | $79,000 | -- |
Source: Public Records
Mortgage History
| Date | Status | Borrower | Loan Amount |
|---|---|---|---|
| Previous Owner | Malloch Steven | $142,373 |
Source: Public Records
Tax History Compared to Growth
Tax History
| Year | Tax Paid | Tax Assessment Tax Assessment Total Assessment is a certain percentage of the fair market value that is determined by local assessors to be the total taxable value of land and additions on the property. | Land | Improvement |
|---|---|---|---|---|
| 2024 | $1,277 | $157,400 | $21,200 | $136,200 |
| 2023 | $1,132 | $146,300 | $19,300 | $127,000 |
| 2022 | $1,046 | $125,400 | $15,900 | $109,500 |
| 2021 | $850 | $106,200 | $14,200 | $92,000 |
| 2020 | $904 | $107,100 | $13,500 | $93,600 |
| 2019 | $843 | $104,600 | $13,500 | $91,100 |
| 2018 | $877 | $105,000 | $13,500 | $91,500 |
| 2017 | $767 | $92,400 | $13,500 | $78,900 |
| 2016 | $1,868 | $91,800 | $13,500 | $78,300 |
| 2014 | $565 | $85,700 | $13,500 | $72,200 |
Source: Public Records
Map
Nearby Homes
- 501 E Quincy St
- 202 E King St
- 515 E Keyser St
- 502 S Britton St
- 1700 South Rd
- 412 S Walsh St
- 312 S Lee St
- 0 S Colony Dr
- 419 N Franklin St
- 301 E High St
- 404 S Randolph St
- 104 S Cowen St
- 410 S Cowen St
- 317 Conductor Cove
- 401 S Peters St
- 609 S Cowen St
- 404 S Peters St
- 309 Forrest Park Dr
- 301 Forrest Park Dr
- 819 S Peters St