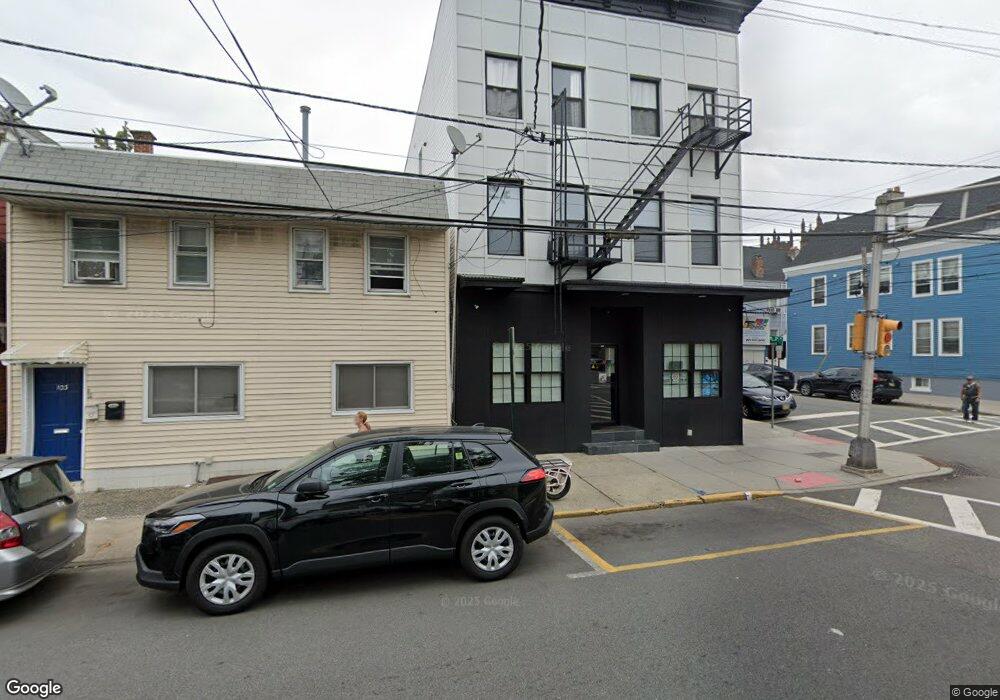
101 N 3rd St East Newark, NJ 07029
Estimated Value: $2,105,177
--
Bed
--
Bath
4,584
Sq Ft
$459/Sq Ft
Est. Value
About This Home
This home is located at 101 N 3rd St, East Newark, NJ 07029 and is currently estimated at $2,105,177, approximately $459 per square foot. 101 N 3rd St is a home located in Hudson County with nearby schools including Kennedy Elementary School, Hamilton Intermediate School, and Lincoln No. 3 Elementary School.
Ownership History
Date
Name
Owned For
Owner Type
Purchase Details
Closed on
Dec 8, 2023
Sold by
334 Buffalo Ave Paterson Llc
Bought by
Dah Fah Llc
Current Estimated Value
Home Financials for this Owner
Home Financials are based on the most recent Mortgage that was taken out on this home.
Original Mortgage
$1,100,000
Outstanding Balance
$1,079,019
Interest Rate
7.03%
Mortgage Type
New Conventional
Estimated Equity
$1,026,158
Purchase Details
Closed on
Dec 15, 2020
Sold by
Suarez Pablo and Suarez Andrea
Bought by
334 Buffalo Ave Paterson Llc
Purchase Details
Closed on
Jun 27, 2007
Sold by
Davitt Patricia
Bought by
Suarez Pablo
Home Financials for this Owner
Home Financials are based on the most recent Mortgage that was taken out on this home.
Original Mortgage
$378,750
Interest Rate
6.48%
Mortgage Type
Commercial
Create a Home Valuation Report for This Property
The Home Valuation Report is an in-depth analysis detailing your home's value as well as a comparison with similar homes in the area
Home Values in the Area
Average Home Value in this Area
Purchase History
| Date | Buyer | Sale Price | Title Company |
|---|---|---|---|
| Dah Fah Llc | $1,950,000 | Chicago Title | |
| Dah Fah Llc | $1,950,000 | Chicago Title | |
| 334 Buffalo Ave Paterson Llc | $550,000 | Interstate 1St Title | |
| Suarez Pablo | $505,000 | None Available |
Source: Public Records
Mortgage History
| Date | Status | Borrower | Loan Amount |
|---|---|---|---|
| Open | Dah Fah Llc | $1,100,000 | |
| Closed | Dah Fah Llc | $1,100,000 | |
| Previous Owner | Suarez Pablo | $378,750 |
Source: Public Records
Tax History Compared to Growth
Tax History
| Year | Tax Paid | Tax Assessment Tax Assessment Total Assessment is a certain percentage of the fair market value that is determined by local assessors to be the total taxable value of land and additions on the property. | Land | Improvement |
|---|---|---|---|---|
| 2025 | $16,567 | $706,200 | $190,000 | $516,200 |
| 2024 | $12,534 | $706,200 | $190,000 | $516,200 |
| 2023 | $12,534 | $545,200 | $190,000 | $355,200 |
| 2022 | $12,436 | $545,200 | $190,000 | $355,200 |
| 2021 | $12,229 | $545,200 | $190,000 | $355,200 |
| 2020 | $12,431 | $545,200 | $190,000 | $355,200 |
| 2019 | $11,131 | $153,300 | $40,000 | $113,300 |
| 2018 | $11,061 | $153,300 | $40,000 | $113,300 |
| 2017 | $11,097 | $153,300 | $40,000 | $113,300 |
| 2016 | $11,044 | $153,300 | $40,000 | $113,300 |
| 2015 | $10,742 | $153,300 | $40,000 | $113,300 |
| 2014 | $10,542 | $153,300 | $40,000 | $113,300 |
Source: Public Records
Map
Nearby Homes
- 228 Hamilton St
- 221 William St
- 323 William St
- 313 Central Ave
- 213 Central Ave
- 349 N 2nd St
- 351 N 2nd St
- 115 Grant Ave
- 105 Grant Ave
- 344 John St
- 430 Central Ave
- 607 Frank E Rodgers Blvd N
- 133 Sussex St
- 310 Passaic Ave Unit 308
- 441 John St
- 308 Davis Ave
- 36 6th St
- 200 Dey St Unit 260
- 200 Dey St Unit 266
- 503 Cross St
- 101 N 3rd St Unit STORE
- 101 N 3rd St Unit 3
- 101 N 3rd St Unit 1F
- 101 N 3rd St Unit 1B
- 101 N 3rd St Unit 3B
- 101 N 3rd St Unit 3F
- 101 N 3rd St Unit 2B
- 101 N 3rd St Unit 2F
- 103 N 3rd St
- 105 N 3rd St
- 15 N 3rd St
- 107 N 3rd St
- 308-310 Cleveland Ave Unit 2
- 308-310 Cleveland Ave
- 308 Cleveland Ave Unit 310
- 308 Cleveland Ave Unit 2
- 308 Cleveland Ave Unit 4
- 100 N 3rd St Unit 102
- 13 N 3rd St
- 109 N 3rd St