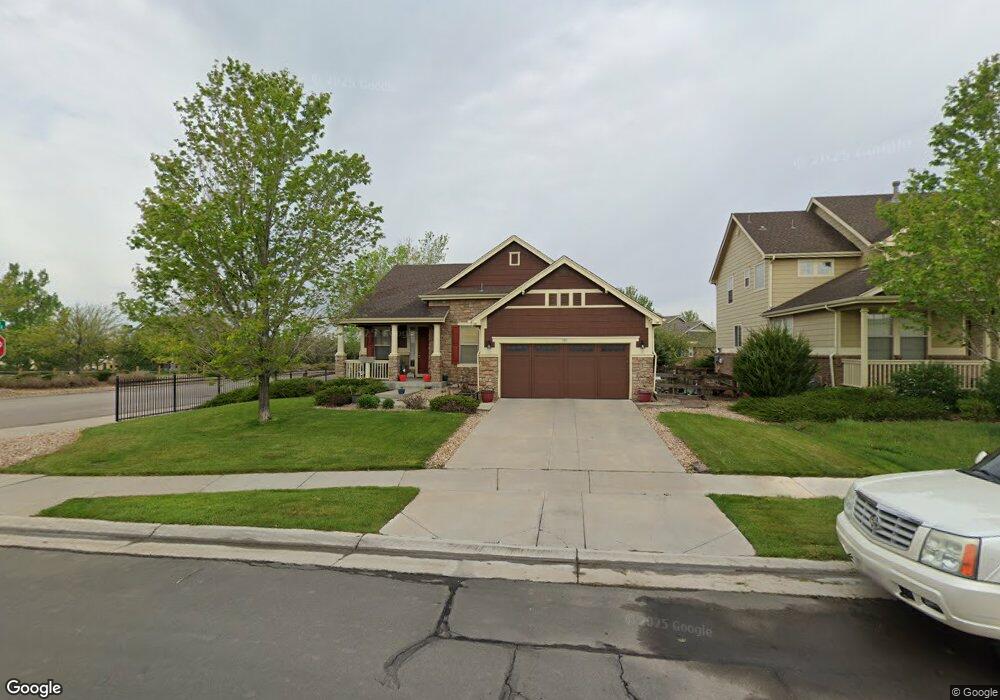
101 N Elk Ct Aurora, CO 80018
Estimated Value: $530,911 - $652,000
3
Beds
3
Baths
1,877
Sq Ft
$312/Sq Ft
Est. Value
About This Home
This home is located at 101 N Elk Ct, Aurora, CO 80018 and is currently estimated at $584,728, approximately $311 per square foot. 101 N Elk Ct is a home located in Arapahoe County with nearby schools including Vista Peak Exploratory and Vista Peak 9-12 Preparatory.
Ownership History
Date
Name
Owned For
Owner Type
Purchase Details
Closed on
Feb 9, 2017
Sold by
Oliver Marsha V and Oliver Allan Marsha
Bought by
Oliver Marsha V
Current Estimated Value
Home Financials for this Owner
Home Financials are based on the most recent Mortgage that was taken out on this home.
Original Mortgage
$307,285
Outstanding Balance
$249,873
Interest Rate
3.75%
Mortgage Type
FHA
Estimated Equity
$334,855
Purchase Details
Closed on
Sep 28, 2010
Sold by
Lawrence Allan Marsha Virginia and Lawrence Allan Robert
Bought by
Allan Marsha Virginia
Purchase Details
Closed on
Mar 31, 2006
Sold by
Kb Home Colorado Inc
Bought by
Allan Robert L and Allan Marsha V
Home Financials for this Owner
Home Financials are based on the most recent Mortgage that was taken out on this home.
Original Mortgage
$240,000
Interest Rate
7.37%
Mortgage Type
Purchase Money Mortgage
Create a Home Valuation Report for This Property
The Home Valuation Report is an in-depth analysis detailing your home's value as well as a comparison with similar homes in the area
Purchase History
| Date | Buyer | Sale Price | Title Company |
|---|---|---|---|
| Oliver Marsha V | -- | None Available | |
| Allan Marsha Virginia | -- | None Available | |
| Allan Robert L | $300,000 | Security Title |
Source: Public Records
Mortgage History
| Date | Status | Borrower | Loan Amount |
|---|---|---|---|
| Open | Oliver Marsha V | $307,285 | |
| Closed | Allan Robert L | $240,000 |
Source: Public Records
Tax History
| Year | Tax Paid | Tax Assessment Tax Assessment Total Assessment is a certain percentage of the fair market value that is determined by local assessors to be the total taxable value of land and additions on the property. | Land | Improvement |
|---|---|---|---|---|
| 2025 | $4,679 | $35,475 | -- | -- |
| 2024 | $4,624 | $35,014 | -- | -- |
| 2023 | $4,624 | $35,014 | $0 | $0 |
| 2022 | $4,326 | $29,121 | $0 | $0 |
| 2021 | $4,460 | $29,121 | $0 | $0 |
| 2020 | $4,404 | $28,372 | $0 | $0 |
| 2019 | $4,388 | $28,372 | $0 | $0 |
| 2018 | $4,335 | $26,143 | $0 | $0 |
| 2017 | $4,260 | $26,143 | $0 | $0 |
| 2016 | $3,560 | $22,256 | $0 | $0 |
| 2015 | $3,487 | $22,256 | $0 | $0 |
| 2014 | $3,042 | $18,698 | $0 | $0 |
| 2013 | -- | $18,930 | $0 | $0 |
Source: Public Records
Map
Nearby Homes
- 161 N Elk Ct
- 59 S de Gaulle St
- 23843 E 2nd Dr
- 85 N Coolidge St
- 24346 E 5th Place
- 127 S Coolidge St
- 23626 E 5th Place
- 23616 E 5th Place
- 239 N Irvington St
- 23584 E 5th Place
- 23576 E 5th Place
- 23627 E 5th Place
- 25029 E 3rd Place
- 23376 E 5th Place Unit 101
- 23405 E 5th Place Unit 201
- 25167 E Ellsworth Place
- 207 S Irvington St
- 25183 E 2nd Ave
- 23401 E 5th Dr Unit 104
- 24790 E Alameda Ave
- 121 N Elk Ct
- 141 N Elk Ct
- 24142 E 2nd Dr
- 24300 E 2nd Place
- 24152 E 2nd Dr
- 23594 E 2nd Place
- 23616 E 2nd Place
- 23656 E 2nd Place
- 23664 E 2nd Place
- 23711 E 2nd Place
- 23626 E 2nd Place
- 23646 E 2nd Place
- 23614 E 2nd Place
- 23586 E 2nd Place
- 23584 E 2nd Place
- 23491 E 2nd Place
- 23501 E 2nd Place
- 23486 E 2nd Place
- 23506 E 2nd Place
- 23474 E 2nd Place
Your Personal Tour Guide
Ask me questions while you tour the home.