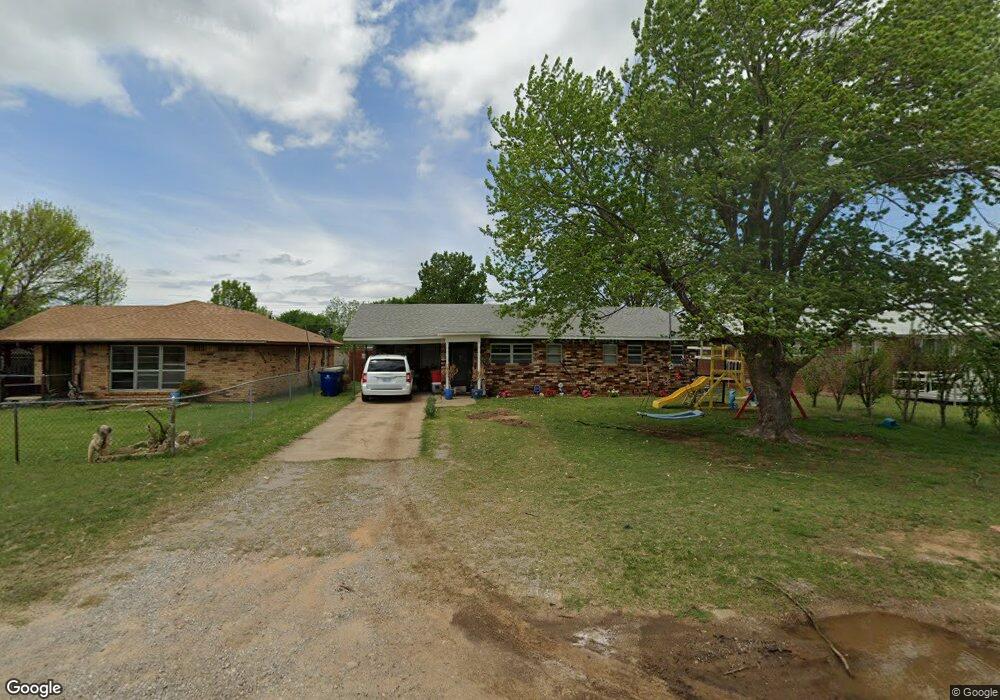
101 N G St Duncan, OK 73533
Estimated Value: $72,000 - $101,000
3
Beds
2
Baths
1,187
Sq Ft
$74/Sq Ft
Est. Value
About This Home
This home is located at 101 N G St, Duncan, OK 73533 and is currently estimated at $88,232, approximately $74 per square foot. 101 N G St is a home located in Stephens County with nearby schools including Woodrow Wilson Elementary School, Duncan Middle School, and Duncan High School.
Ownership History
Date
Name
Owned For
Owner Type
Purchase Details
Closed on
May 24, 2012
Sold by
Soutee William and Soutee Donna
Bought by
Mcnabb Steven L
Current Estimated Value
Home Financials for this Owner
Home Financials are based on the most recent Mortgage that was taken out on this home.
Original Mortgage
$48,995
Outstanding Balance
$34,650
Interest Rate
4.5%
Mortgage Type
FHA
Estimated Equity
$53,582
Purchase Details
Closed on
Jun 14, 2002
Sold by
Tenco Petroleum Inc
Purchase Details
Closed on
Feb 28, 2001
Sold by
Golden Return Investments
Purchase Details
Closed on
Feb 14, 2000
Sold by
United States Marshal
Create a Home Valuation Report for This Property
The Home Valuation Report is an in-depth analysis detailing your home's value as well as a comparison with similar homes in the area
Purchase History
| Date | Buyer | Sale Price | Title Company |
|---|---|---|---|
| Mcnabb Steven L | -- | None Available | |
| -- | $48,000 | -- | |
| -- | $12,000 | -- | |
| -- | -- | -- |
Source: Public Records
Mortgage History
| Date | Status | Borrower | Loan Amount |
|---|---|---|---|
| Open | Mcnabb Steven L | $48,995 |
Source: Public Records
Tax History
| Year | Tax Paid | Tax Assessment Tax Assessment Total Assessment is a certain percentage of the fair market value that is determined by local assessors to be the total taxable value of land and additions on the property. | Land | Improvement |
|---|---|---|---|---|
| 2025 | $508 | $7,026 | $231 | $6,795 |
| 2024 | $498 | $6,845 | $231 | $6,614 |
| 2023 | $498 | $6,846 | $231 | $6,615 |
| 2022 | $464 | $6,646 | $231 | $6,415 |
| 2021 | $464 | $6,453 | $231 | $6,222 |
| 2020 | $439 | $6,083 | $231 | $5,852 |
| 2019 | $425 | $5,917 | $231 | $5,686 |
| 2018 | $463 | $6,209 | $231 | $5,978 |
| 2017 | $431 | $6,200 | $231 | $5,969 |
| 2016 | $412 | $5,844 | $231 | $5,613 |
| 2015 | $440 | $5,674 | $231 | $5,443 |
| 2014 | $440 | $5,509 | $550 | $4,959 |
Source: Public Records
Map
Nearby Homes
Your Personal Tour Guide
Ask me questions while you tour the home.