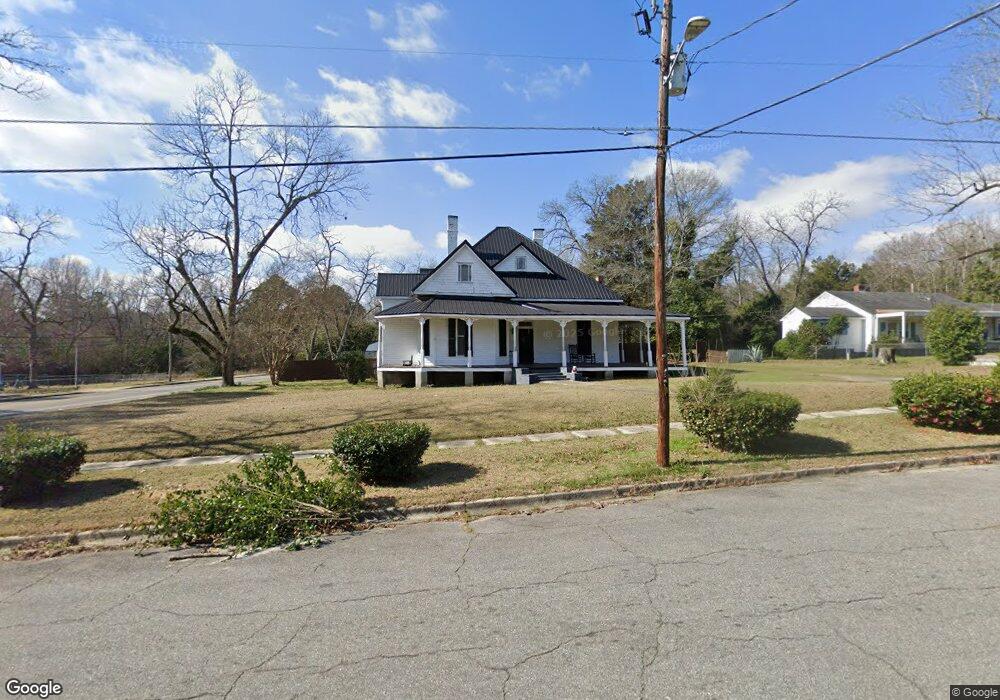
101 N Randolph St Oglethorpe, GA 31068
Estimated Value: $142,000 - $204,000
2
Beds
2
Baths
2,330
Sq Ft
$79/Sq Ft
Est. Value
About This Home
This home is located at 101 N Randolph St, Oglethorpe, GA 31068 and is currently estimated at $184,369, approximately $79 per square foot. 101 N Randolph St is a home with nearby schools including Macon County Elementary School, Macon County Middle School, and Macon County High School.
Ownership History
Date
Name
Owned For
Owner Type
Purchase Details
Closed on
Jul 17, 2024
Sold by
Saldana Lori Ann
Bought by
Saldana David and Saldana David Pineda
Current Estimated Value
Purchase Details
Closed on
Nov 7, 2019
Sold by
Saldana Lori Ann Estate
Bought by
Saldana David Pineda and Saldana David Pineda
Purchase Details
Closed on
Mar 26, 2011
Sold by
Price Daryl
Bought by
Mortgage America Inc
Purchase Details
Closed on
Mar 26, 2002
Sold by
Smith Jon Christopher
Bought by
Price Daryl
Purchase Details
Closed on
Nov 30, 1999
Sold by
Hagen Marie
Bought by
Smith Jon Christoph
Purchase Details
Closed on
Jun 26, 1992
Sold by
Collins Rodney Russ
Bought by
Hagen Marie
Purchase Details
Closed on
Oct 19, 1986
Sold by
Williams Martha Ann
Bought by
Collins Rodney Russ
Purchase Details
Closed on
Apr 26, 1984
Bought by
Williams Martha Ann
Create a Home Valuation Report for This Property
The Home Valuation Report is an in-depth analysis detailing your home's value as well as a comparison with similar homes in the area
Purchase History
| Date | Buyer | Sale Price | Title Company |
|---|---|---|---|
| Saldana David | -- | -- | |
| Saldana David Pineda | -- | -- | |
| Mortgage America Inc | $63,500 | -- | |
| Price Daryl | $66,900 | -- | |
| Smith Jon Christoph | -- | -- | |
| Hagen Marie | $53,000 | -- | |
| Collins Rodney Russ | $10,000 | -- | |
| Williams Martha Ann | -- | -- |
Source: Public Records
Tax History
| Year | Tax Paid | Tax Assessment Tax Assessment Total Assessment is a certain percentage of the fair market value that is determined by local assessors to be the total taxable value of land and additions on the property. | Land | Improvement |
|---|---|---|---|---|
| 2025 | $2,384 | $62,247 | $2,392 | $59,855 |
| 2024 | $2,697 | $62,247 | $2,392 | $59,855 |
| 2023 | $2,672 | $61,687 | $2,392 | $59,295 |
| 2022 | $1,154 | $41,680 | $2,392 | $39,288 |
| 2021 | $1,083 | $25,156 | $2,392 | $22,764 |
| 2020 | $692 | $24,688 | $2,392 | $22,296 |
| 2019 | $1,063 | $24,688 | $2,392 | $22,296 |
| 2018 | $693 | $24,688 | $2,392 | $22,296 |
| 2017 | $693 | $24,688 | $2,392 | $22,296 |
| 2016 | $696 | $24,688 | $2,392 | $22,296 |
| 2015 | -- | $26,296 | $2,392 | $23,904 |
| 2014 | -- | $26,296 | $2,392 | $23,904 |
| 2013 | -- | $26,296 | $2,392 | $23,904 |
Source: Public Records
Map
Nearby Homes
- 1220 Georgia 49
- 432 Clifton Bradley Dr
- 310 Sumter St
- 311 Macon St
- 502 Kaigler St
- 204 Jordan St
- 503 S Dooly St
- 511 Forsyth St
- 110 E Artesian Ave
- 100 Minor Ave
- 505 Engram St
- 202 Minor Ave
- 515 Engram St
- 514 Patricia Dr
- 504 Patricia Dr
- 510 Patricia Dr
- 303 Christopher Cir
- 301 Christopher Cir
- 312 Christopher Cir
- 311 Hillcrest Dr
- 105 Randolph St
- 102 N Randolph St
- 109 Randolph St
- 104 N Randolph St
- 104 S Randolph St
- 205 Cuyler St
- 307 W Cuyler St
- 205 Chatham St
- 201 N Randolph St
- 206 Cuyler St
- 113 Baker St
- 306 W Cuyler St
- Whitewater Rd
- Whitewater Rd
- TBD Georgia 49
- 104 Baker St
- 202 Cuyler St
- 204 N Randolph St
- 203 N Randolph St
- 204 S Randolph St
Your Personal Tour Guide
Ask me questions while you tour the home.