Estimated Value: $431,000 - $514,000
2
Beds
2
Baths
1,464
Sq Ft
$320/Sq Ft
Est. Value
About This Home
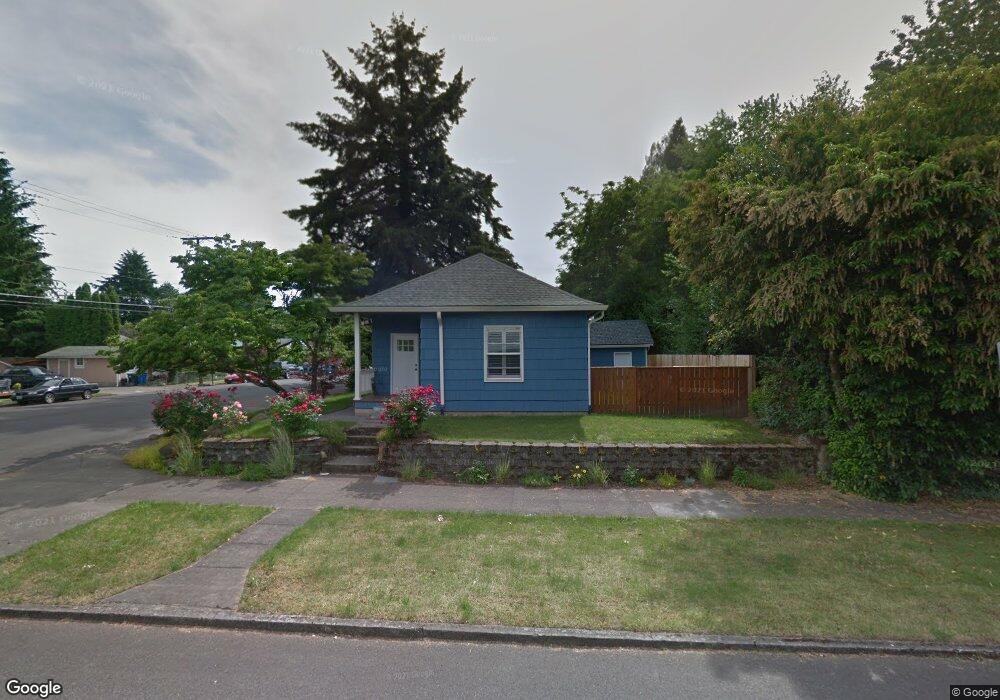
This home is located at 101 NE Garfield St, Camas, WA 98607 and is currently estimated at $468,883, approximately $320 per square foot. 101 NE Garfield St is a home located in Clark County with nearby schools including Helen Baller Elementary School, Liberty Middle School, and Camas High School.
Ownership History
Date
Name
Owned For
Owner Type
Purchase Details
Closed on
Dec 29, 2017
Sold by
Mullin William H and Mullin Mary Lou
Bought by
Camas Corner Llc
Current Estimated Value
Purchase Details
Closed on
Dec 2, 2016
Sold by
Mullin William H and Mullin Mary L
Bought by
Mullin William H and Mullin Mary Lou
Purchase Details
Closed on
Mar 21, 2016
Sold by
Myer Janelle Autry and Autry Janelle S
Bought by
Mullin William H and Mullin Mary L
Home Financials for this Owner
Home Financials are based on the most recent Mortgage that was taken out on this home.
Original Mortgage
$187,500
Interest Rate
3.65%
Mortgage Type
New Conventional
Purchase Details
Closed on
Oct 7, 2010
Sold by
Deutsche Bank National Trust Company
Bought by
Autry Janelle S
Home Financials for this Owner
Home Financials are based on the most recent Mortgage that was taken out on this home.
Original Mortgage
$115,261
Interest Rate
4.75%
Mortgage Type
FHA
Purchase Details
Closed on
Jun 30, 2010
Sold by
Burris Eric J
Bought by
Deutsche Bank National Trust Company
Purchase Details
Closed on
Feb 4, 2008
Sold by
Deschutes Funding Inc
Bought by
Lotterberry Janaya M
Purchase Details
Closed on
May 15, 2007
Sold by
Burris Eric J
Bought by
Deschutes Funding Inc
Purchase Details
Closed on
May 10, 2006
Sold by
Kratz Robin V
Bought by
Burris Eric J
Home Financials for this Owner
Home Financials are based on the most recent Mortgage that was taken out on this home.
Original Mortgage
$96,500
Interest Rate
8%
Mortgage Type
Purchase Money Mortgage
Purchase Details
Closed on
Apr 6, 2006
Sold by
Burris Cari
Bought by
Burris Eric J
Home Financials for this Owner
Home Financials are based on the most recent Mortgage that was taken out on this home.
Original Mortgage
$96,500
Interest Rate
8%
Mortgage Type
Purchase Money Mortgage
Purchase Details
Closed on
Jul 1, 2003
Sold by
Kratz John Daniel
Bought by
Kratz John Daniel and Kratz Robin
Home Financials for this Owner
Home Financials are based on the most recent Mortgage that was taken out on this home.
Original Mortgage
$65,600
Interest Rate
4.44%
Mortgage Type
Balloon
Purchase Details
Closed on
Jun 20, 2003
Sold by
Gilson Gladys Adeline
Bought by
Kratz John Daniel
Home Financials for this Owner
Home Financials are based on the most recent Mortgage that was taken out on this home.
Original Mortgage
$65,600
Interest Rate
4.44%
Mortgage Type
Balloon
Create a Home Valuation Report for This Property
The Home Valuation Report is an in-depth analysis detailing your home's value as well as a comparison with similar homes in the area
Home Values in the Area
Average Home Value in this Area
Purchase History
| Date | Buyer | Sale Price | Title Company |
|---|---|---|---|
| Camas Corner Llc | -- | None Available | |
| Mullin William H | -- | None Available | |
| Mullin William H | $250,000 | Clark County Title Company | |
| Autry Janelle S | $88,000 | Chicago Title | |
| Deutsche Bank National Trust Company | $90,000 | None Available | |
| Lotterberry Janaya M | -- | None Available | |
| Deschutes Funding Inc | $147,025 | Fidelity National Title | |
| Burris Eric J | $137,900 | First American Title | |
| Burris Eric J | -- | First American Title | |
| Kratz John Daniel | -- | Clark County Title | |
| Kratz John Daniel | $82,000 | Clark County Title |
Source: Public Records
Mortgage History
| Date | Status | Borrower | Loan Amount |
|---|---|---|---|
| Previous Owner | Mullin William H | $187,500 | |
| Previous Owner | Autry Janelle S | $115,261 | |
| Previous Owner | Burris Eric J | $96,500 | |
| Previous Owner | Burris Eric J | $27,600 | |
| Previous Owner | Kratz John Daniel | $65,600 | |
| Closed | Kratz John Daniel | $8,000 |
Source: Public Records
Tax History Compared to Growth
Tax History
| Year | Tax Paid | Tax Assessment Tax Assessment Total Assessment is a certain percentage of the fair market value that is determined by local assessors to be the total taxable value of land and additions on the property. | Land | Improvement |
|---|---|---|---|---|
| 2025 | $3,571 | $319,819 | $88,765 | $231,054 |
| 2024 | $3,258 | $374,206 | $138,473 | $235,733 |
| 2023 | $3,528 | $366,901 | $134,923 | $231,978 |
| 2022 | $3,258 | $377,991 | $134,923 | $243,068 |
| 2021 | $3,261 | $291,818 | $104,743 | $187,075 |
| 2020 | $3,194 | $270,798 | $97,642 | $173,156 |
| 2019 | $3,025 | $245,956 | $88,765 | $157,191 |
| 2018 | $2,905 | $248,142 | $0 | $0 |
| 2017 | $2,469 | $200,326 | $0 | $0 |
| 2016 | $2,133 | $186,181 | $0 | $0 |
| 2015 | $1,993 | $159,308 | $0 | $0 |
| 2014 | -- | $140,315 | $0 | $0 |
| 2013 | -- | $126,213 | $0 | $0 |
Source: Public Records
Map
Nearby Homes
- 136 NE Garfield St
- 924 NE 3rd Ave
- 632 NE Everett St
- 761 SE Polk St
- 1907 NE Garfield St
- 659 SE Russell St
- 1303 Division St
- 753 SE Sumner St
- 520 NE Province Dr
- 741 SE Tampa St
- 0 SE Tampa St Unit NWM2442817
- 726 SE Tampa St
- 0 SE Tampa St Unit 650912142
- 0 SE Tampa St Unit 626113580
- 522 NE Province Dr
- 1623 Division St
- 750 NE Province Ct
- 124 NW 18th Ave
- 2193 NE 3rd Ave
- 536 NW 10th Ave
- 115 NE Garfield St
- 105 SE Garfield St
- 106 NE Garfield St
- 715 E 1st Ave
- 726 NE 2nd Ave
- 120 NE Garfield St
- 106 SE Garfield St
- 118 SE Garfield St
- 712 NE 2nd Ave
- 115 SE Garfield St
- 701 E 1st Ave
- 823 E 1st Ave
- 108 SE Franklin St
- 116 SE Franklin St
- 125 SE Garfield St
- 824 E 1st Ave
- 708 NE 2nd Ave
- 826 NE 2nd Ave
- 126 SE Garfield St
- 126 SE Franklin St