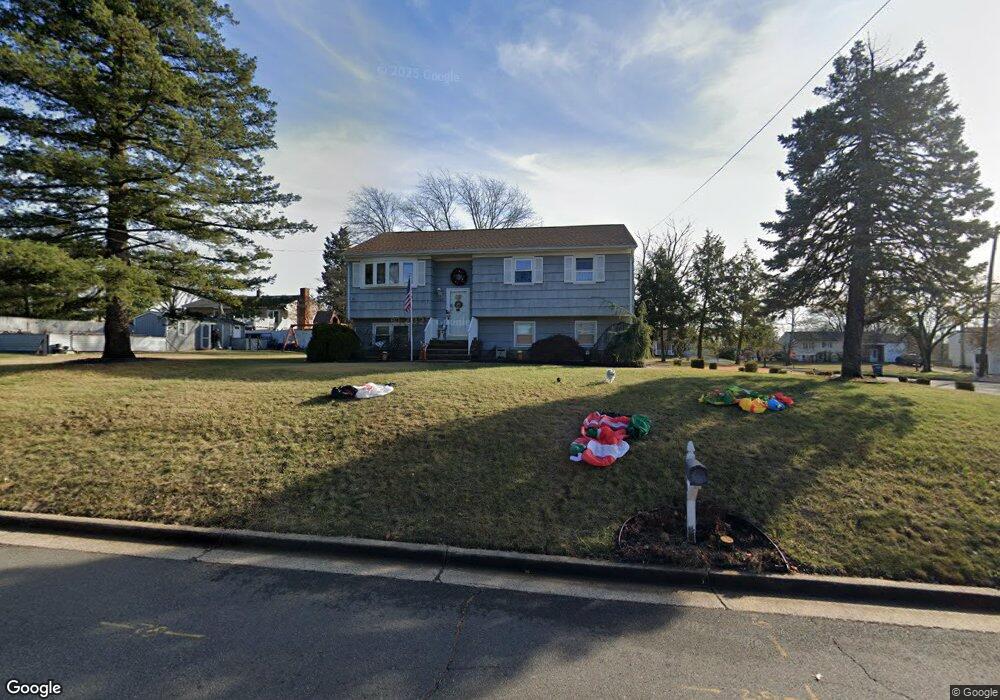
101 New Brook Dr Piscataway, NJ 08854
Estimated Value: $638,807 - $733,000
4
Beds
2
Baths
1,738
Sq Ft
$387/Sq Ft
Est. Value
About This Home
This home is located at 101 New Brook Dr, Piscataway, NJ 08854 and is currently estimated at $671,952, approximately $386 per square foot. 101 New Brook Dr is a home located in Middlesex County with nearby schools including Martin Luther King Intermediate School, Knollwood Elementary School, and Conackamack Middle School.
Ownership History
Date
Name
Owned For
Owner Type
Purchase Details
Closed on
Nov 13, 2014
Sold by
Faerber Linda
Bought by
Grekos Thedore and Grekos Anastasia
Current Estimated Value
Home Financials for this Owner
Home Financials are based on the most recent Mortgage that was taken out on this home.
Original Mortgage
$288,000
Outstanding Balance
$220,047
Interest Rate
3.93%
Mortgage Type
New Conventional
Estimated Equity
$451,905
Purchase Details
Closed on
Jul 26, 2010
Sold by
Faerber Jonathan and Faerber Linda
Bought by
Faerber Linda
Purchase Details
Closed on
Jul 28, 2000
Sold by
Hickson Norwood
Bought by
Faerber Jontahn and Phua Linda
Home Financials for this Owner
Home Financials are based on the most recent Mortgage that was taken out on this home.
Original Mortgage
$153,900
Interest Rate
8.21%
Create a Home Valuation Report for This Property
The Home Valuation Report is an in-depth analysis detailing your home's value as well as a comparison with similar homes in the area
Home Values in the Area
Average Home Value in this Area
Purchase History
| Date | Buyer | Sale Price | Title Company |
|---|---|---|---|
| Grekos Thedore | $335,000 | Foundation Title Llc | |
| Faerber Linda | -- | Multiple | |
| Faerber Jontahn | $203,900 | -- |
Source: Public Records
Mortgage History
| Date | Status | Borrower | Loan Amount |
|---|---|---|---|
| Open | Grekos Thedore | $288,000 | |
| Previous Owner | Faerber Jontahn | $153,900 |
Source: Public Records
Tax History Compared to Growth
Tax History
| Year | Tax Paid | Tax Assessment Tax Assessment Total Assessment is a certain percentage of the fair market value that is determined by local assessors to be the total taxable value of land and additions on the property. | Land | Improvement |
|---|---|---|---|---|
| 2025 | $9,307 | $597,600 | $301,300 | $296,300 |
| 2024 | $8,997 | $475,600 | $194,400 | $281,200 |
| 2023 | $8,997 | $430,500 | $194,400 | $236,100 |
| 2022 | $8,634 | $383,400 | $194,400 | $189,000 |
| 2021 | $8,155 | $348,200 | $194,400 | $153,800 |
| 2020 | $8,241 | $352,800 | $184,400 | $168,400 |
| 2019 | $7,853 | $330,500 | $184,400 | $146,100 |
| 2018 | $7,635 | $321,900 | $184,400 | $137,500 |
| 2017 | $7,908 | $288,500 | $159,400 | $129,100 |
| 2016 | $7,761 | $288,500 | $159,400 | $129,100 |
| 2015 | $7,651 | $288,500 | $159,400 | $129,100 |
| 2014 | $7,478 | $288,500 | $159,400 | $129,100 |
Source: Public Records
Map
Nearby Homes
- 32 Lincoln Ave
- 36 Lincoln Ave
- 105 New Brook Dr
- 106 New Brook Dr
- 112 New Brook Dr
- 69 New Brook Dr
- 28 Lincoln Ave
- 40 Lincoln Ave
- 96 New Brook Dr
- 5201 Beatty St
- 37 Lincoln Ave
- 33 Lincoln Ave
- 105 Rivercrest Dr
- 41 Lincoln Ave
- 111 New Brook Dr
- 118 New Brook Dr
- 109 Rivercrest Dr
- 29 Lincoln Ave
- 50 New Brook Dr
- 44 Lincoln Ave