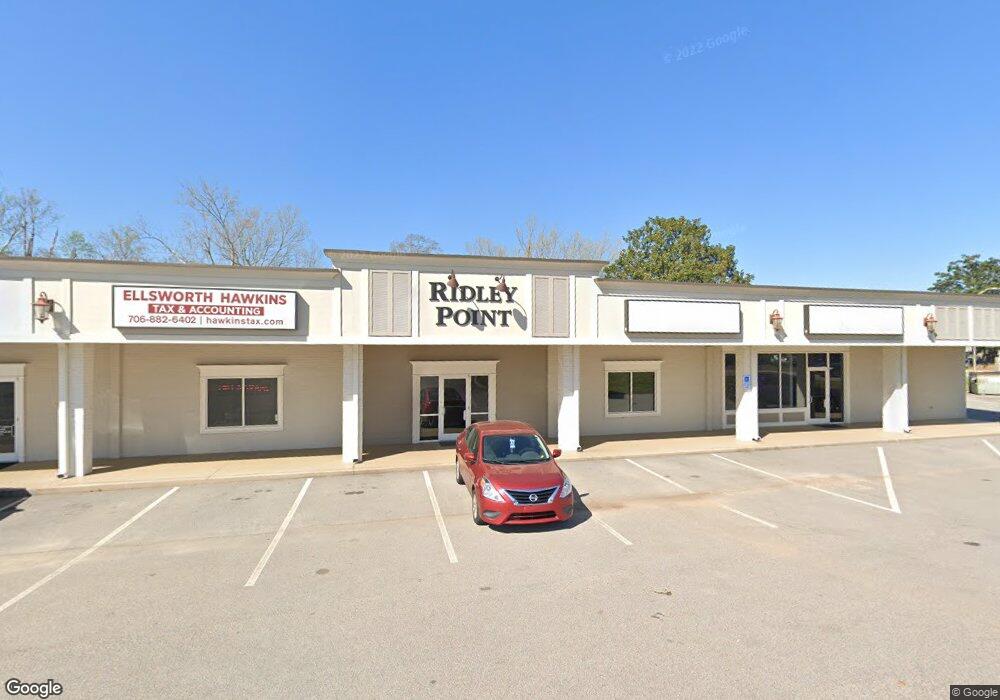
101 New Franklin Rd Unit Office Space C & D Lagrange, GA 30240
Estimated Value: $482,463
--
Bed
1
Bath
4,230
Sq Ft
$114/Sq Ft
Est. Value
About This Home
This home is located at 101 New Franklin Rd Unit Office Space C & D, Lagrange, GA 30240 and is currently priced at $482,463, approximately $114 per square foot. 101 New Franklin Rd Unit Office Space C & D is a home located in Troup County with nearby schools including Franklin Forest Elementary School, Hollis Hand Elementary School, and Ethel W. Kight Elementary School.
Ownership History
Date
Name
Owned For
Owner Type
Purchase Details
Closed on
Feb 7, 2020
Sold by
Ridley Point Llc
Bought by
Cr Retail Grp Llc
Current Estimated Value
Purchase Details
Closed on
Jul 20, 2016
Sold by
Jason L
Bought by
Ridley Point Llc
Purchase Details
Closed on
Dec 17, 1996
Sold by
Mary Meadors
Bought by
Meadors Jason L
Purchase Details
Closed on
May 1, 1986
Sold by
Jason L Meadors
Bought by
Mary Meadors
Purchase Details
Closed on
Jun 1, 1967
Sold by
Mrs H S Burdett
Bought by
Jason L Meadors
Create a Home Valuation Report for This Property
The Home Valuation Report is an in-depth analysis detailing your home's value as well as a comparison with similar homes in the area
Home Values in the Area
Average Home Value in this Area
Purchase History
| Date | Buyer | Sale Price | Title Company |
|---|---|---|---|
| Cr Retail Grp Llc | $300,000 | -- | |
| Ridley Point Llc | -- | -- | |
| Meadors Jason L | -- | -- | |
| Mary Meadors | -- | -- | |
| Jason L Meadors | -- | -- |
Source: Public Records
Tax History Compared to Growth
Tax History
| Year | Tax Paid | Tax Assessment Tax Assessment Total Assessment is a certain percentage of the fair market value that is determined by local assessors to be the total taxable value of land and additions on the property. | Land | Improvement |
|---|---|---|---|---|
| 2024 | $3,997 | $146,560 | $19,280 | $127,280 |
| 2023 | $3,880 | $142,280 | $19,280 | $123,000 |
| 2022 | $2,958 | $124,680 | $19,280 | $105,400 |
| 2021 | $3,619 | $120,120 | $19,280 | $100,840 |
| 2020 | $3,623 | $120,120 | $19,280 | $100,840 |
| 2019 | $2,647 | $87,760 | $19,280 | $68,480 |
| 2018 | $1,989 | $65,960 | $19,280 | $46,680 |
| 2017 | $2,045 | $65,960 | $19,280 | $46,680 |
| 2016 | $3,276 | $108,612 | $38,605 | $70,007 |
| 2015 | $3,422 | $113,276 | $37,964 | $75,312 |
| 2014 | $3,428 | $113,276 | $37,964 | $75,312 |
| 2013 | -- | $113,276 | $37,964 | $75,312 |
Source: Public Records
Map
Nearby Homes
- 609 Ridley Ave
- 707 Ridley Ave
- 611 Ridley Ave
- 615 Ridley Ave
- 709 Ridley Ave
- 301 E Bacon St
- 0 Ridley Ave Unit 10550104
- 206 Broad St
- 600,606,608,616 S Harlem
- 408 Gordon St
- 219 Banks St
- 101 McGee St
- 109 Thomas St
- 105 Saynor Cir
- 519 Greenville St
- 600 S Harlem Cir
- 131 Foch St
- 606 S Harlem Cir
- 706 N Harlem Cir
- 803 1/2 Hines St
- 101 New Franklin Rd
- 101 New Franklin Rd Unit OFFICE SPACE C
- 101 New Franklin Rd Unit D
- 406 Ridley Ave
- 408 Ridley Ave
- 410 Ridley Ave
- 412 Ridley Ave
- 306 Ridley Ave
- 102 W Bacon St
- 419 Ridley Ave
- 0 Corporate Plaza Dr
- 500 Ridley Ave
- 105 Corporate Park E Unit B
- 105 Corporate Park E Unit A
- 105 Corporate Park E Unit C
- 302 N Morgan St
- 105 Corporate Plaza Dr
- 105 Corporate Plaza Dr Unit B
- 105 Corporate Plaza Dr Unit A
- 501 Ridley Ave