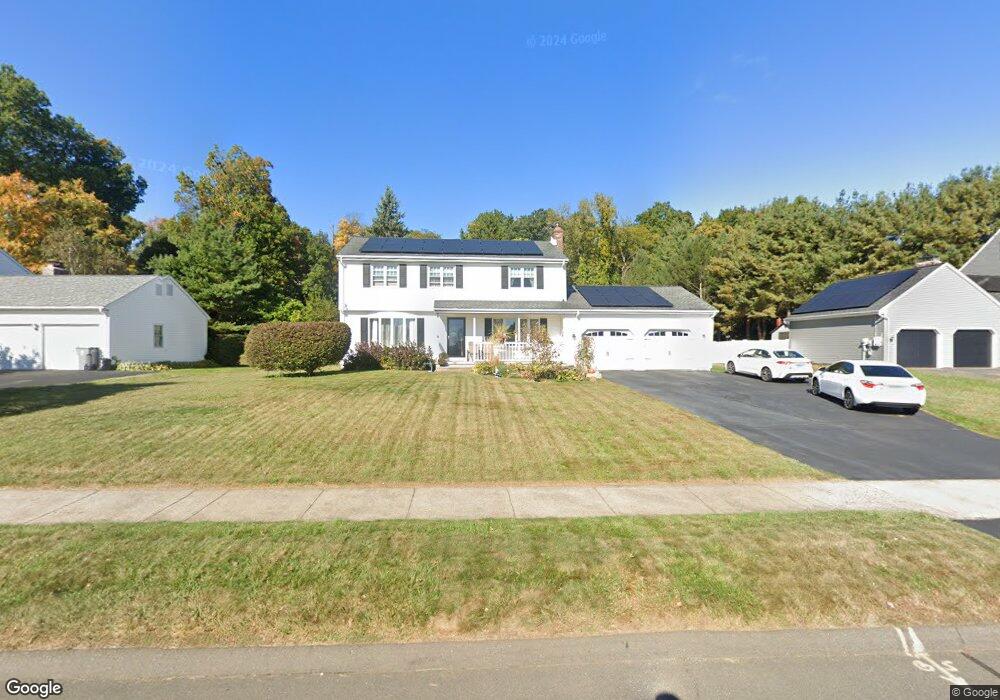
101 Northwest Dr Plainville, CT 06062
Estimated Value: $481,989 - $502,000
4
Beds
7
Baths
2,156
Sq Ft
$229/Sq Ft
Est. Value
About This Home
This home is located at 101 Northwest Dr, Plainville, CT 06062 and is currently estimated at $492,997, approximately $228 per square foot. 101 Northwest Dr is a home located in Hartford County with nearby schools including Middle School Of Plainville, Plainville High School, and St Matthew School.
Ownership History
Date
Name
Owned For
Owner Type
Purchase Details
Closed on
Nov 9, 2009
Sold by
Ardvini Frederick W
Bought by
Nilson Randy B and Nilson Kelly A
Current Estimated Value
Home Financials for this Owner
Home Financials are based on the most recent Mortgage that was taken out on this home.
Original Mortgage
$155,500
Interest Rate
5.06%
Purchase Details
Closed on
Jun 17, 2005
Sold by
Stdenis Kyle and Stdenis Julie
Bought by
Arduini Frederick W and Arduini Diane S
Purchase Details
Closed on
Mar 26, 2001
Sold by
Starrett Brian E and Starrett Jodi N
Bought by
Levigne Julie
Purchase Details
Closed on
Nov 27, 2000
Sold by
Labbe Gerald O and Labbe Patricia M
Bought by
Starrett Brian E and Starrett Jodi N
Create a Home Valuation Report for This Property
The Home Valuation Report is an in-depth analysis detailing your home's value as well as a comparison with similar homes in the area
Home Values in the Area
Average Home Value in this Area
Purchase History
| Date | Buyer | Sale Price | Title Company |
|---|---|---|---|
| Nilson Randy B | $296,500 | -- | |
| Nilson Randy B | $296,500 | -- | |
| Arduini Frederick W | $329,000 | -- | |
| Arduini Frederick W | $329,000 | -- | |
| Levigne Julie | $235,000 | -- | |
| Levigne Julie | $235,000 | -- | |
| Starrett Brian E | $220,000 | -- | |
| Starrett Brian E | $220,000 | -- |
Source: Public Records
Mortgage History
| Date | Status | Borrower | Loan Amount |
|---|---|---|---|
| Open | Starrett Brian E | $141,000 | |
| Closed | Starrett Brian E | $155,500 |
Source: Public Records
Tax History Compared to Growth
Tax History
| Year | Tax Paid | Tax Assessment Tax Assessment Total Assessment is a certain percentage of the fair market value that is determined by local assessors to be the total taxable value of land and additions on the property. | Land | Improvement |
|---|---|---|---|---|
| 2025 | $7,776 | $226,310 | $52,290 | $174,020 |
| 2024 | $7,387 | $226,310 | $52,290 | $174,020 |
| 2023 | $7,111 | $226,310 | $52,290 | $174,020 |
| 2022 | $6,934 | $226,310 | $52,290 | $174,020 |
| 2021 | $6,774 | $196,000 | $47,530 | $148,470 |
| 2020 | $6,786 | $196,000 | $47,530 | $148,470 |
| 2019 | $6,786 | $196,000 | $47,530 | $148,470 |
| 2018 | $6,633 | $196,000 | $47,530 | $148,470 |
| 2017 | $6,405 | $196,000 | $47,530 | $148,470 |
| 2016 | $6,528 | $204,050 | $47,530 | $156,520 |
| 2015 | $6,495 | $204,050 | $47,530 | $156,520 |
| 2014 | $6,869 | $218,890 | $49,700 | $169,190 |
Source: Public Records
Map
Nearby Homes
- 5 Peach Orchard Hill
- 18 Timber Hill Rd
- 109 Glenwood Dr
- 23 Bel Aire Dr
- 9 Murzen Ln
- 25 Willow Brook Dr Unit 25
- 0 Overlook Dr Unit Lot 4 24092448
- 0 Overlook Dr Unit Lot 3 24092446
- 8 Farmington Chase Crescent
- 47 Julie Rd
- 27 Farmington Chase Crescent
- 16 Cardinal Dr
- 129 Farmington Chase Crescent Unit 129
- 3 Bushel Rd Unit 3
- 27 Oakwood Cir Unit 8
- 23 Junior Rd
- 25 Oakwood Cir Unit 7
- 205 Camp St
- 245 Mark St
- 6 Bruce Ave
- 103 Northwest Dr
- 99 Northwest Dr
- 105 Northwest Dr
- 97 Northwest Dr
- 20 Peach Orchard Hill
- 107 Northwest Dr
- 22 Peach Orchard Hill
- 24 Peach Orchard Hill
- 28 Peach Orchard Hill
- 23 Peach Orchard Hill
- 18 Peach Orchard Hill
- 16 Peach Orchard Hill
- 30 Peach Orchard Hill
- 109 Northwest Dr
- 111 Northwest Dr
- 113 Northwest Dr
- 17 Peach Orchard Hill
- 29 Peach Orchard Hill
- 32 Peach Orchard Hill
- 37 Peach Orchard Hill