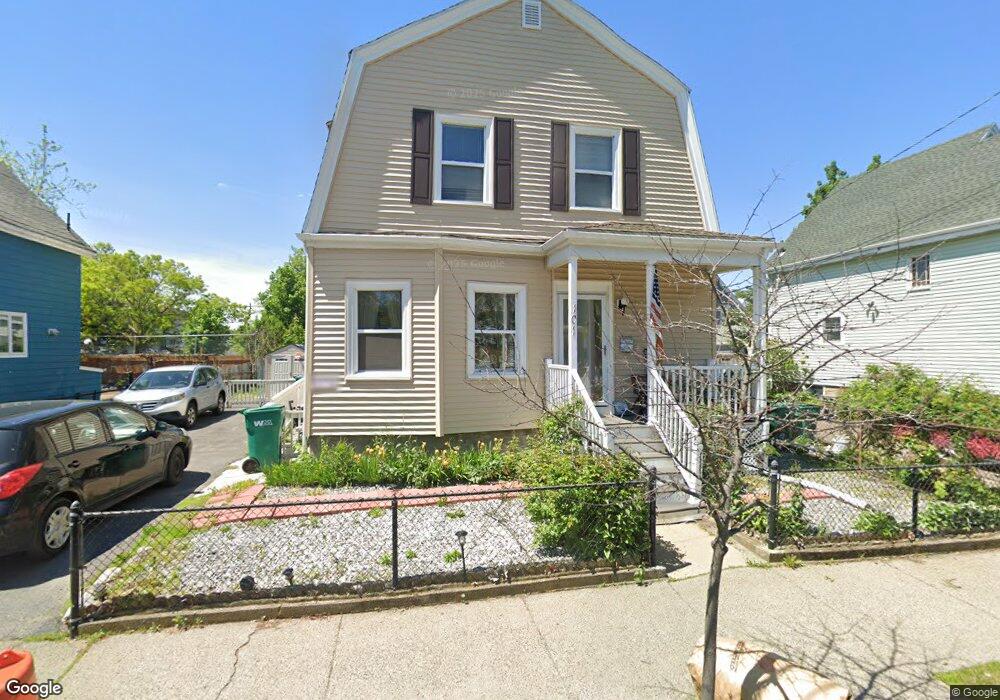
101 Orchard St Lynn, MA 01905
Lynnway NeighborhoodEstimated Value: $553,844 - $559,000
3
Beds
2
Baths
1,389
Sq Ft
$400/Sq Ft
Est. Value
About This Home
This home is located at 101 Orchard St, Lynn, MA 01905 and is currently estimated at $556,211, approximately $400 per square foot. 101 Orchard St is a home located in Essex County with nearby schools including Cokato Elementary School, William P Connery Elementary School, and North Park Elementary School.
Ownership History
Date
Name
Owned For
Owner Type
Purchase Details
Closed on
Aug 30, 2010
Sold by
Department Of Housing & Urban Dev
Bought by
Alvarado Maria J and Santiago Orlando
Current Estimated Value
Home Financials for this Owner
Home Financials are based on the most recent Mortgage that was taken out on this home.
Original Mortgage
$5,000
Outstanding Balance
$3,302
Interest Rate
4.44%
Estimated Equity
$552,909
Purchase Details
Closed on
Sep 18, 2009
Sold by
Bac Home Loans Svcng L
Bought by
Department Of Housing & Urban Dev
Purchase Details
Closed on
May 21, 2009
Sold by
Ruiz Nelson
Bought by
Bac Home Loans Svcs Lp
Purchase Details
Closed on
Jan 19, 2006
Sold by
Escobar Carlos and Osorio Cristina
Bought by
Ruiz Nelson
Purchase Details
Closed on
Jul 7, 2003
Sold by
Gorham Mary E Est
Bought by
Escobar Carlos and Osorio Christina
Create a Home Valuation Report for This Property
The Home Valuation Report is an in-depth analysis detailing your home's value as well as a comparison with similar homes in the area
Home Values in the Area
Average Home Value in this Area
Purchase History
| Date | Buyer | Sale Price | Title Company |
|---|---|---|---|
| Alvarado Maria J | $136,000 | -- | |
| Alvarado Maria J | $136,000 | -- | |
| Department Of Housing & Urban Dev | -- | -- | |
| Department Of Housing & Urban Dev | -- | -- | |
| Bac Home Loans Svcs Lp | $308,192 | -- | |
| Bac Home Loans Svcs Lp | $308,192 | -- | |
| Ruiz Nelson | $290,000 | -- | |
| Ruiz Nelson | $290,000 | -- | |
| Escobar Carlos | $248,000 | -- | |
| Escobar Carlos | $248,000 | -- |
Source: Public Records
Mortgage History
| Date | Status | Borrower | Loan Amount |
|---|---|---|---|
| Open | Escobar Carlos | $5,000 | |
| Open | Escobar Carlos | $179,450 |
Source: Public Records
Tax History Compared to Growth
Tax History
| Year | Tax Paid | Tax Assessment Tax Assessment Total Assessment is a certain percentage of the fair market value that is determined by local assessors to be the total taxable value of land and additions on the property. | Land | Improvement |
|---|---|---|---|---|
| 2025 | $5,385 | $519,800 | $198,900 | $320,900 |
| 2024 | $4,972 | $472,200 | $182,800 | $289,400 |
| 2023 | $4,655 | $417,500 | $162,800 | $254,700 |
| 2022 | $4,727 | $380,300 | $153,000 | $227,300 |
| 2021 | $4,244 | $325,700 | $126,200 | $199,500 |
| 2020 | $3,952 | $294,900 | $105,400 | $189,500 |
| 2019 | $3,814 | $266,700 | $90,500 | $176,200 |
| 2018 | $3,827 | $252,600 | $99,000 | $153,600 |
| 2017 | $3,777 | $242,100 | $87,600 | $154,500 |
| 2016 | $3,702 | $228,800 | $82,900 | $145,900 |
| 2015 | $3,425 | $204,500 | $71,400 | $133,100 |
Source: Public Records
Map
Nearby Homes
- 15 Neptune Street Ct
- 8 Ray St
- 93 South St
- 103 Warren St
- 16 River St Unit 6
- 45 Cottage St Unit 3
- 19 Hood St
- 3 River Street Ct
- 20 Murray St
- 20 Huss Ct Unit 105
- 693 Western Ave Unit 101
- 9 Needhams Landing
- 39 Centre St
- 662-664 Western Ave
- 86 Laurel St
- 28 Margin St Unit A
- 14 River Street Place
- 121 N Common St
- 79 Laurel St
- 69 N Common St