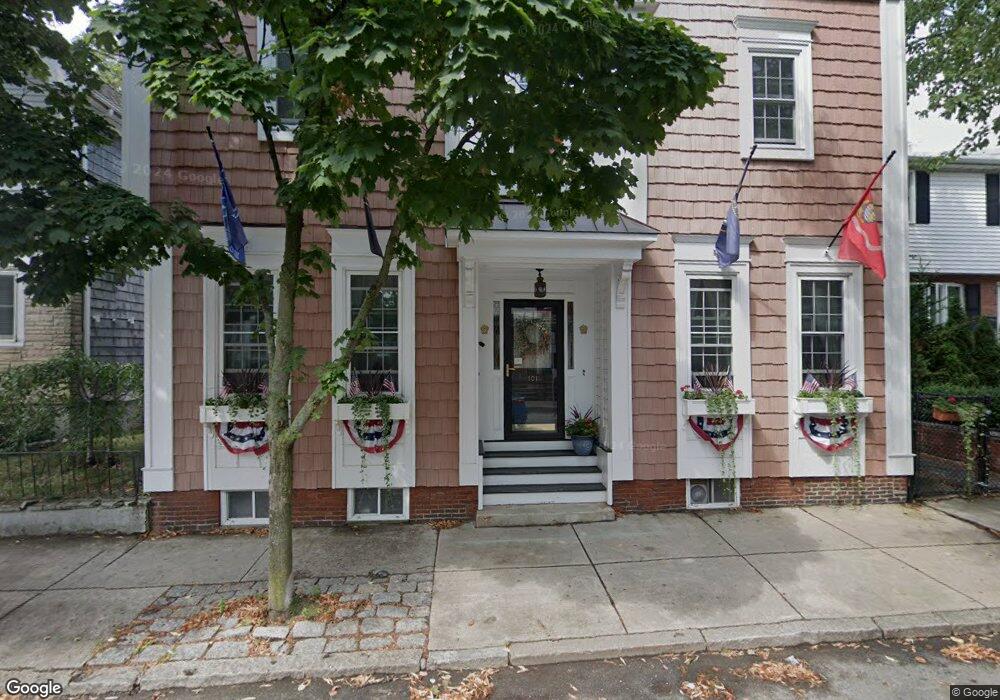
101 P St Boston, MA 02127
South Boston NeighborhoodEstimated Value: $1,627,284 - $1,778,000
4
Beds
2
Baths
2,549
Sq Ft
$661/Sq Ft
Est. Value
About This Home
This home is located at 101 P St, Boston, MA 02127 and is currently estimated at $1,684,821, approximately $660 per square foot. 101 P St is a home located in Suffolk County with nearby schools including South Boston Catholic Academy, Gate of Heaven Elementary School, and St Peter Academy.
Ownership History
Date
Name
Owned For
Owner Type
Purchase Details
Closed on
Mar 6, 1997
Sold by
Bailey John F and Bailey Mary K
Bought by
Bailey William J and Bailey Maureen R
Current Estimated Value
Purchase Details
Closed on
May 20, 1994
Sold by
Mcneil Maureen A and Stedman George P
Bought by
Bailey John F and Bailey Mary K
Create a Home Valuation Report for This Property
The Home Valuation Report is an in-depth analysis detailing your home's value as well as a comparison with similar homes in the area
Home Values in the Area
Average Home Value in this Area
Purchase History
| Date | Buyer | Sale Price | Title Company |
|---|---|---|---|
| Bailey William J | $140,000 | -- | |
| Bailey John F | $100,000 | -- |
Source: Public Records
Mortgage History
| Date | Status | Borrower | Loan Amount |
|---|---|---|---|
| Open | Bailey John F | $221,000 | |
| Closed | Bailey John F | $175,000 |
Source: Public Records
Tax History Compared to Growth
Tax History
| Year | Tax Paid | Tax Assessment Tax Assessment Total Assessment is a certain percentage of the fair market value that is determined by local assessors to be the total taxable value of land and additions on the property. | Land | Improvement |
|---|---|---|---|---|
| 2025 | $15,620 | $1,348,900 | $330,800 | $1,018,100 |
| 2024 | $15,761 | $1,446,000 | $348,400 | $1,097,600 |
| 2023 | $14,375 | $1,338,500 | $322,500 | $1,016,000 |
| 2022 | $13,239 | $1,216,800 | $293,100 | $923,700 |
| 2021 | $12,606 | $1,181,400 | $284,600 | $896,800 |
| 2020 | $9,973 | $944,400 | $268,800 | $675,600 |
| 2019 | $9,478 | $899,200 | $211,000 | $688,200 |
| 2018 | $7,489 | $714,600 | $211,000 | $503,600 |
| 2017 | $7,208 | $680,600 | $211,000 | $469,600 |
| 2016 | $6,931 | $630,100 | $211,000 | $419,100 |
| 2015 | $7,448 | $615,000 | $189,800 | $425,200 |
| 2014 | $6,769 | $538,100 | $189,800 | $348,300 |
Source: Public Records
Map
Nearby Homes
- 907 E 4th St Unit 2
- 915 E 4th St
- 933 E Broadway
- 945 E Broadway Unit 7
- 901 E Broadway Unit 1
- 803 E 5th St Unit 1
- 33 Lennon Ct Unit 39
- 823 E 6th St Unit 5
- 786 E 6th St Unit 788
- 765 E 3rd St Unit 201
- 37 Farragut Rd Unit 7
- 37 Farragut Rd Unit 6
- 37 Farragut Rd Unit Four
- 37 Farragut Rd Unit 3
- 37 Farragut Rd Unit 5
- 37 Farragut Rd Unit 2
- 52 O St Unit 3
- 761 E 6th St Unit 1
- 722 E 5th St Unit TH
- 733 E 3rd St